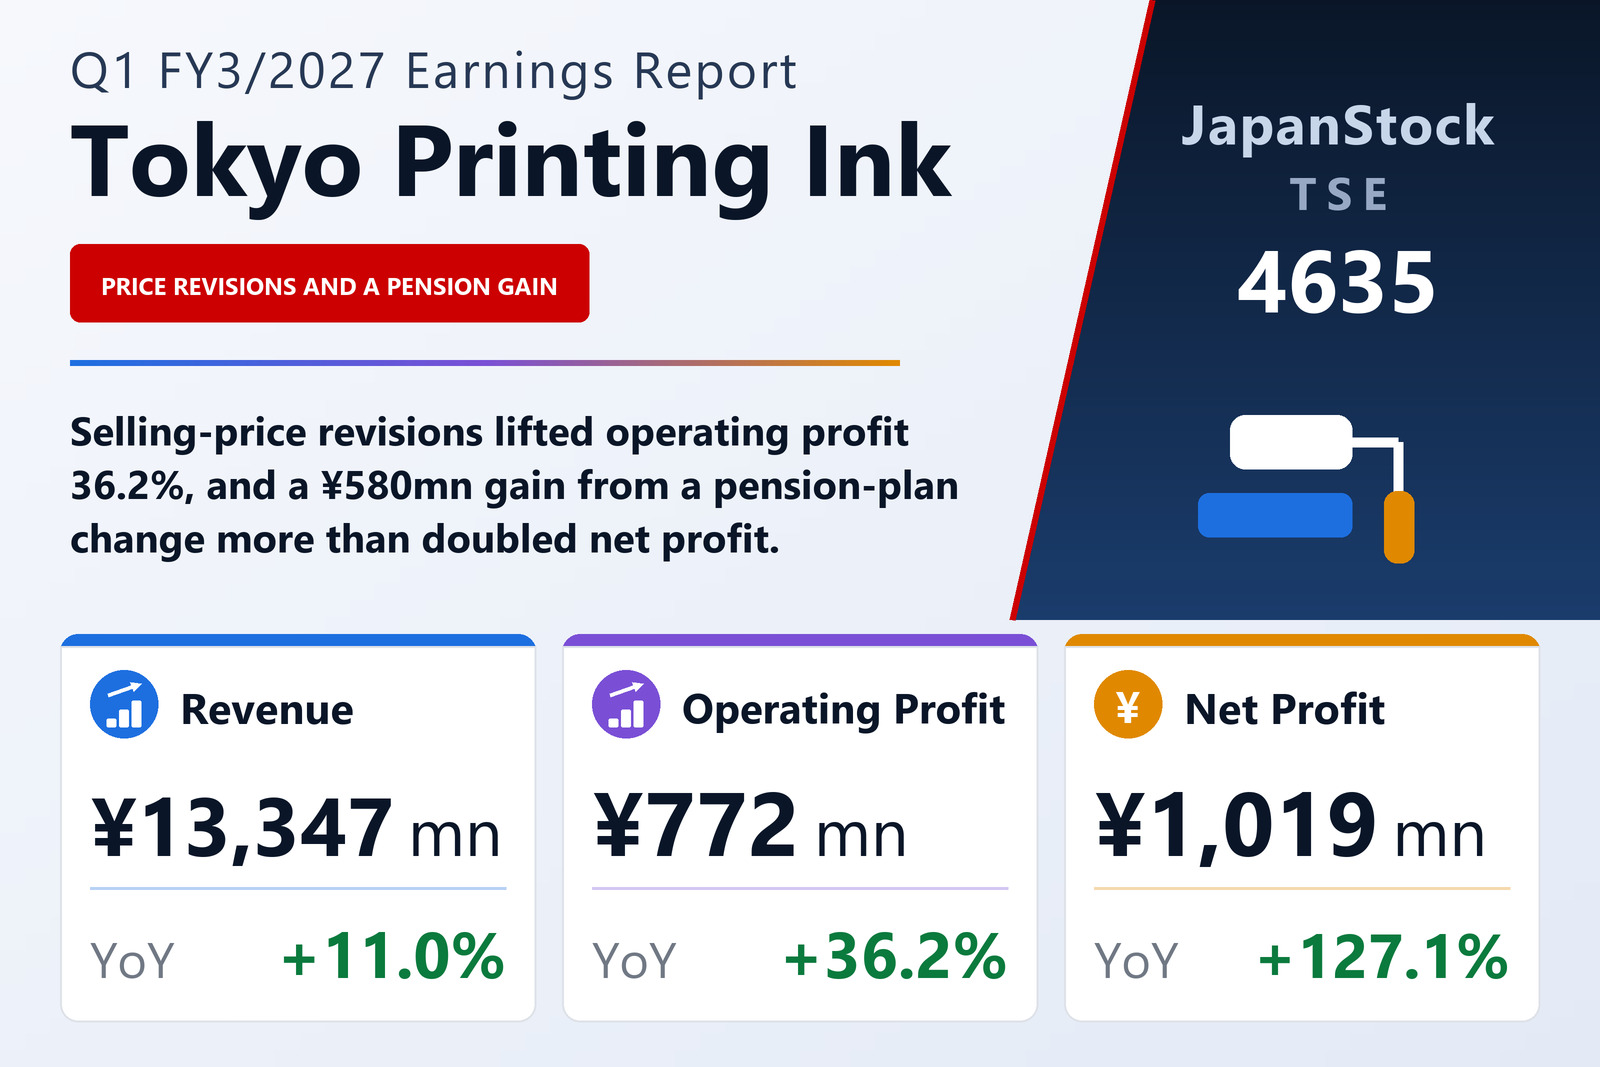
Revenue up 11.0%, operating profit up 36.2%
Tokyo Printing Ink Mfg. Co., Ltd. (TSE: 4635), which makes printing inks, plastic masterbatches and compounds, and processed plastic products such as nets, films and geocell civil-engineering materials, published consolidated results for the first quarter of FY3/2027 — the three months from April 1 to June 30, 2026 — on August 5, 2026 under Japanese GAAP. Revenue rose 11.0% to ¥13,347 million, operating profit 36.2% to ¥772 million, ordinary profit 34.0% to ¥884 million and profit attributable to owners of the parent 127.1% to ¥1,019 million. Earnings per share were ¥81.59 against ¥35.11, both stated on the basis of the five-for-one stock split carried out on January 1, 2026. The company is listed on the Tokyo Stock Exchange, and the quarterly statements were not reviewed by an auditor.
The company describes a quarter of rising raw-material prices, supply constraints and supplier price increases, driven by crude-oil prices that stayed high amid instability in the Middle East, and says that securing appropriate selling-price revisions was its most important task. It also cites portfolio optimisation and a shift to higher-value products under its medium-term plan, “TOKYOink 2027”. The income statement shows the effect. Cost of sales rose 10.0% to ¥11,015 million, a little slower than revenue, so gross profit rose 15.9% to ¥2,332 million and the gross margin widened from 16.7% to 17.5%. Selling, general and administrative expenses rose only 7.9% to ¥1,559 million, even with packing and shipping costs up from ¥317 million to ¥357 million and bonuses from ¥73 million to ¥104 million, and the operating margin improved from 4.7% to 5.8%.
A one-off pension gain explains most of the net-profit jump
Non-operating income rose to ¥148 million from ¥123 million, chiefly on dividends received of ¥119 million against ¥86 million and a foreign-exchange gain of ¥11 million after a ¥7 million loss a year earlier. Non-operating expenses were ¥37 million against ¥30 million, including interest of ¥18 million. Ordinary profit therefore rose 34.0% to ¥884 million, close to the rate at the operating line. The large step came below it: extraordinary income of ¥585 million, almost all of it a ¥580 million gain on revision of the retirement benefit plan, recorded because part of the defined-benefit corporate pension plan was moved to a corporate defined-contribution plan. Pre-tax profit rose 122.8% to ¥1,468 million; without the ¥580 million gain it would have been ¥888 million, up about 35%. Income taxes were ¥447 million against ¥206 million, leaving profit attributable to owners of the parent at ¥1,019 million.
Earnings per share rose faster than net profit, by 132.4%, because the average number of shares outstanding fell from 12,782,056 to 12,494,666. Comprehensive income moved the other way, falling 71.1% to ¥200 million from ¥694 million. The remeasurement of retirement benefits contributed −¥967 million to other comprehensive income, which totalled −¥819 million against +¥242 million a year earlier, and the filing ties the fall in accumulated other comprehensive income to the same pension transition. The gain in the income statement and the charge in other comprehensive income are therefore two sides of one event.
Three of four segments grew profit; ink did not
The Ink segment grew revenue 11.9% to ¥4,896 million, but segment profit fell 4.3% to ¥249 million. Offset inks and printing materials gained sales through stronger selling to key customers and new accounts, but lost profit because higher raw-material costs have still not been fully passed on in selling prices. Gravure inks grew both sales and profit on functional inks and coatings, products for medical packaging and the effect of price revisions, while inkjet inks declined in both because orders for contract-manufactured products for Europe fell. Chemical Products — masterbatches and resin compounds sold in Japan and in ASEAN markets centred on Thailand — was the largest segment, with revenue up 7.7% to ¥6,339 million and profit up 33.6% to ¥310 million. Own-brand products in Japan grew on mobility and functional-packaging uses; contract products in Japan grew sales but lost profit to higher equipment-maintenance costs; and Thailand declined in both, as packaging products stalled, partly for seasonal reasons.
Processed Products showed the sharpest profit move, with revenue up 19.7% to ¥2,089 million and segment profit up 169.4% to ¥236 million from ¥87 million. Netron® nets improved partly because an impairment booked in the previous fiscal year reduced depreciation; uniaxially oriented film grew on food-packaging uses; geocell civil-engineering materials grew on demand for disaster-prevention and foundation work; and agricultural materials grew on the Energy series and a temporary rise in orders for general products. Real Estate Leasing, which rents detached houses and office space in the head-office building, held revenue flat at ¥22 million, with profit of ¥14 million against ¥10 million. Segment profit totalled ¥810 million against ¥591 million, before corporate expenses of ¥37 million against ¥25 million. The segment revenues in the table are sales to external customers; Chemical Products also recorded ¥11 million of intersegment sales.
Borrowings rose while the pension asset shrank
Total assets rose 1.5% to ¥54,492 million from ¥53,673 million at March 31, 2026. Accounts receivable rose ¥593 million, electronically recorded receivables ¥268 million and inventories ¥550 million, while the net defined benefit asset fell ¥713 million to ¥2,891 million. Liabilities rose 5.0% to ¥22,648 million, chiefly because short-term borrowings increased by ¥1,420 million to ¥2,820 million and trade payables by ¥765 million, partly offset by lower income taxes payable, bonus provisions and long-term borrowings. Net assets fell 0.8% to ¥31,843 million: retained earnings rose ¥556 million, but accumulated other comprehensive income fell ¥819 million. The equity ratio slipped from 59.4% to 58.0%. The company did not prepare a quarterly cash-flow statement; depreciation was ¥387 million against ¥390 million.
Guidance revised and dividend forecast raised
The company revised its first-half and full-year guidance, first published on May 13, 2026, in a separate release issued the same day; the tanshin gives the new figures but not the previous ones. For FY3/2027 it now expects revenue of ¥54,300 million (+8.8%), operating profit of ¥2,700 million (+21.7%), ordinary profit of ¥2,900 million (+18.2%) and profit attributable to owners of ¥2,650 million (+41.9%), or ¥212.09 per share. For the first half it expects revenue of ¥26,500 million and operating profit of ¥1,300 million. The first quarter delivered 24.6% of guided full-year revenue, 28.6% of operating profit and 38.5% of net profit, the last figure lifted by the pension gain.
The filing describes the dividend revision as an increase. The company now plans ¥50.00 at the half-year and ¥45.00 at the year-end, for ¥95.00, against ¥63.00 for FY3/2026 on a post-split basis — ¥26.00 at the half-year, restated from the ¥130.00 actually paid before the split, plus ¥37.00 at the year-end — an increase of 50.8% and about 45% of guided earnings per share. For the rest of the year the company expects a moderate economic recovery, but warns of raw-material and energy costs linked to the Middle East, the effect of continued inflation on consumer spending, and moves in interest rates and exchange rates.
| Metric | Q1 FY3/2027 | Q1 FY3/2026 | Change |
|---|---|---|---|
| Revenue (¥ million) | 13,347 | 12,027 | +11.0% |
| Gross profit (¥ million) | 2,332 | 2,012 | +15.9% |
| Gross margin | 17.5% | 16.7% | +0.8 pt |
| SG&A expenses (¥ million) | 1,559 | 1,445 | +7.9% |
| Operating profit (¥ million) | 772 | 567 | +36.2% |
| Operating margin | 5.8% | 4.7% | +1.1 pt |
| Ordinary profit (¥ million) | 884 | 660 | +34.0% |
| Extraordinary income (¥ million) | 585 | 1 | n.m. |
| Pre-tax profit (¥ million) | 1,468 | 659 | +122.8% |
| Net profit attrib. to owners of parent (¥ million) | 1,019 | 448 | +127.1% |
| Comprehensive income (¥ million) | 200 | 694 | −71.1% |
| EPS (¥) | 81.59 | 35.11 | +132.4% |
| Ink — revenue (¥ million) | 4,896 | 4,375 | +11.9% |
| Ink — segment profit (¥ million) | 249 | 260 | −4.3% |
| Chemical Products — revenue (¥ million) | 6,339 | 5,883 | +7.7% |
| Chemical Products — segment profit (¥ million) | 310 | 232 | +33.6% |
| Processed Products — revenue (¥ million) | 2,089 | 1,745 | +19.7% |
| Processed Products — segment profit (¥ million) | 236 | 87 | +169.4% |
| Real Estate Leasing — revenue (¥ million) | 22 | 22 | +0.1% |
| Real Estate Leasing — segment profit (¥ million) | 14 | 10 | +33.5% |
| Total assets (¥ million) | 54,492 | 53,673 | +1.5% |
| Net assets (¥ million) | 31,843 | 32,106 | −0.8% |
| Equity ratio | 58.0% | 59.4% | −1.4 pt |
| FY3/2027 guidance — revenue (¥ million) | 54,300 | — | +8.8% |
| FY3/2027 guidance — operating profit (¥ million) | 2,700 | — | +21.7% |
| FY3/2027 guidance — ordinary profit (¥ million) | 2,900 | — | +18.2% |
| FY3/2027 guidance — net profit (¥ million) | 2,650 | — | +41.9% |
| FY3/2027 guidance — EPS (¥) | 212.09 | — | — |
| Annual dividend per share (¥) | 95.00 | 63.00 | +50.8% |
JapanStockPulse provides informational content only and does not constitute investment advice. Figures are taken from the company's published earnings short report and may be subject to subsequent revision.