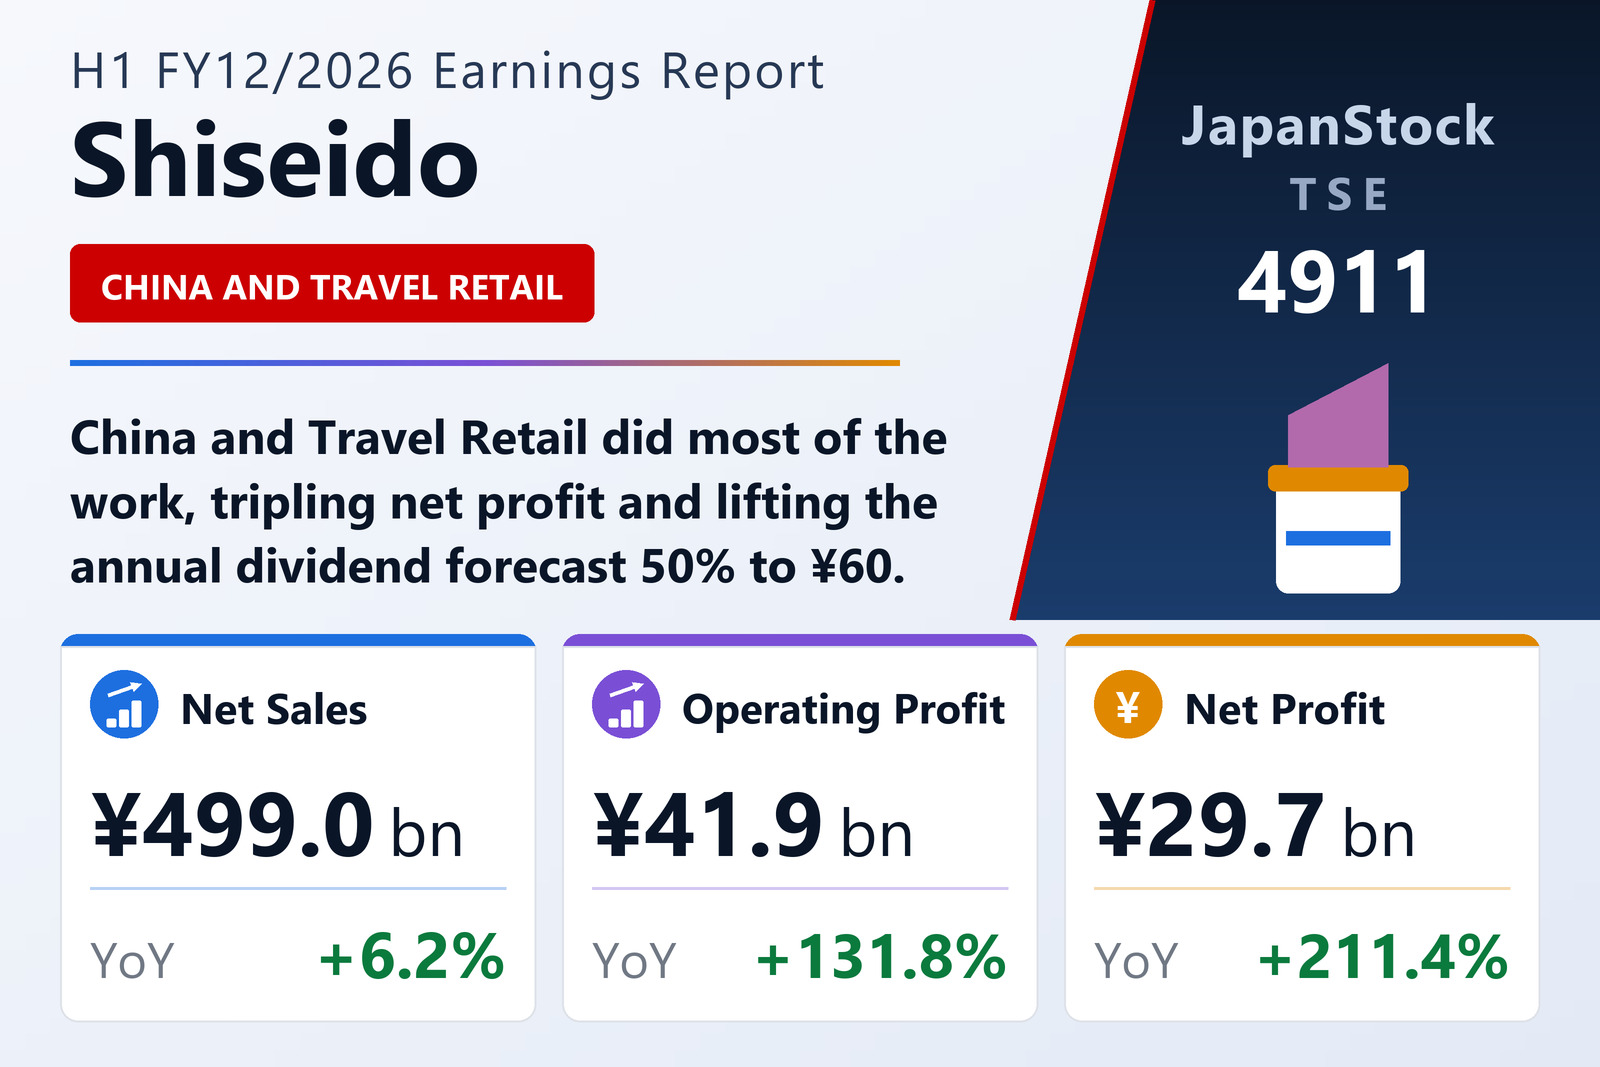
Shiseido Company, Limited (TSE: 4911), Japan's largest cosmetics group, reported consolidated results for the first half of the fiscal year ending December 2026 — the six months from January 1 to June 30, 2026 — under IFRS. Net sales rose 6.2% to ¥498,965 million, core operating profit nearly doubled, up 90.1% to ¥44,432 million, and profit attributable to owners of the parent more than tripled, up 211.4% to ¥29,697 million. Basic earnings per share came in at ¥74.32, against ¥23.87 a year earlier.
The turnaround shows up in the margin
The clearest evidence that Shiseido's multi-year restructuring is working is the margin rather than the top line. The core operating margin widened to 8.9% from 5.0%. Operating profit jumped 131.8% to ¥41,925 million, profit before tax rose 130.2% to ¥44,200 million, and EBITDA advanced 44.2% to ¥70,017 million. Total comprehensive income swung to a positive ¥43,329 million from a negative ¥15,744 million in the prior-year half.
Two definitions matter when reading these numbers. Core operating profit strips non-recurring items — structural-reform costs, impairment losses, acquisition-related expenses and similar charges — out of operating profit, so it is management's preferred measure of underlying trading. EBITDA is core operating profit plus depreciation (excluding depreciation of right-of-use assets) and amortisation.
Underlying demand was flat
The headline growth rate flatters the business. On a like-for-like basis — that is, excluding currency movements and the effect of business divestitures — net sales were down 0.2%. Excluding currency alone, they were down 0.6%. In other words, the reported 6.2% increase was produced by consolidation scope and mix rather than by volume, and Shiseido is still not growing units. That is the single most important caveat sitting underneath an otherwise striking profit recovery.
China & Travel Retail does the heavy lifting
The China & Travel Retail segment is now comfortably the group's largest, at ¥191,406 million of sales (+10.0%) and 38.4% of the total, up from 37.0%. Its core operating profit rose 22.7% to ¥47,630 million at a 24.6% margin, up from 22.1% — a figure larger than the group's entire core operating profit, since head-office costs are carried separately.
Japan, by contrast, slipped 0.8% to ¥144,701 million and fell to 29.0% of sales from 31.0%, though profitability improved: segment core operating profit rose 7.2% to ¥20,911 million for a 14.4% margin, up from 13.3%.
Americas and Asia Pacific swing into the black; Europe still loses money
Two chronically loss-making regions turned positive. The Americas posted a ¥2,015 million core operating profit against a ¥5,830 million loss a year earlier — a ¥7,846 million swing — on sales up 6.0% to ¥54,572 million, lifting the regional margin to 3.6% from −10.8%. Asia Pacific turned in ¥2,222 million against a ¥129 million loss, on sales up 10.1% to ¥37,064 million, for a 5.9% margin.
Europe was the fastest-growing region on the top line, up 12.4% to ¥66,863 million, but remains the outlier on profitability: its core operating loss widened by ¥835 million to ¥3,393 million, a −4.8% margin against −4.1%. The residual "Other" segment, which includes food service, shrank 19.1% to ¥4,357 million while narrowing its loss to ¥173 million from ¥900 million. The six segments together produced ¥69,212 million of core operating profit at a 13.6% margin, reduced to the reported ¥44,432 million by ¥24,779 million of corporate costs and eliminations.
Balance sheet strengthens and the dividend is doubled
Total assets edged up to ¥1,273,863 million from ¥1,267,256 million at the fiscal year-end, while total equity rose to ¥653,951 million from ¥621,270 million. Equity attributable to owners of the parent reached ¥636,618 million from ¥600,756 million, taking the owners' equity ratio to 50.0% from 47.4%. Shares issued stood at 400,000,000, with treasury shares reduced to 375,638 from 463,674.
Shiseido kept its enlarged dividend plan in place: the FY12/2026 annual dividend forecast is ¥60.00 per share (¥30.00 interim plus ¥30.00 year-end), a 50% increase on the ¥40.00 paid for FY12/2025 (¥20.00 plus ¥20.00) and unchanged from the previous announcement. Payment of the interim dividend begins on September 3, 2026.
Full-year guidance left unchanged
Management made no change to its FY12/2026 forecast: net sales of ¥990,000 million (+2.1%), core operating profit of ¥69,000 million (+55.0%), operating profit of ¥59,000 million, profit before tax of ¥60,000 million, profit attributable to owners of ¥42,000 million, and basic EPS of ¥105.12. The first half has already delivered roughly 64% of the full-year core operating profit target and about 71% of the net profit target — a comfortable cushion, but one that implies management is not yet ready to call the recovery complete while underlying sales remain flat.
| Metric | H1 FY12/2026 | H1 FY12/2025 | YoY |
|---|---|---|---|
| Net sales (¥ million) | 498,965 | 469,831 | +6.2% |
| Core operating profit (¥ million) | 44,432 | 23,372 | +90.1% |
| Operating profit (¥ million) | 41,925 | 18,084 | +131.8% |
| Profit before tax (¥ million) | 44,200 | 19,202 | +130.2% |
| Profit attrib. to owners (¥ million) | 29,697 | 9,535 | +211.4% |
| EBITDA (¥ million) | 70,017 | 48,540 | +44.2% |
| Basic EPS (¥) | 74.32 | 23.87 | +211.4% |
| Core operating margin | 8.9% | 5.0% | +3.9pt |
| Like-for-like sales growth | -0.2% | — | — |
| FY12/2026 guidance — net sales (¥ million) | 990,000 | — | +2.1% |
| FY12/2026 guidance — core operating profit (¥ million) | 69,000 | — | +55.0% |
| FY12/2026 guidance — operating profit (¥ million) | 59,000 | — | — |
| FY12/2026 guidance — profit before tax (¥ million) | 60,000 | — | — |
| FY12/2026 guidance — profit attrib. to owners (¥ million) | 42,000 | — | — |
| FY12/2026 guidance — basic EPS (¥) | 105.12 | — | — |
| Full-year dividend (¥) | 60.00 | 40.00 | +50.0% |
| Segment | Net sales (¥ million) | Sales YoY | Core operating profit (¥ million) |
|---|---|---|---|
| Japan | 144,701 | -0.8% | 20,911 |
| China & Travel Retail | 191,406 | +10.0% | 47,630 |
| Asia Pacific | 37,064 | +10.1% | 2,222 |
| Americas | 54,572 | +6.0% | 2,015 |
| Europe | 66,863 | +12.4% | -3,393 |
| Other (incl. food service) | 4,357 | -19.1% | -173 |
| Segment subtotal | 498,965 | +6.2% | 69,212 |
| Corporate / eliminations | — | — | -24,779 |
| Consolidated total | 498,965 | +6.2% | 44,432 |
JapanStockPulse provides informational content only and does not constitute investment advice. Figures are taken from the company's published earnings short report and may be subject to subsequent revision.