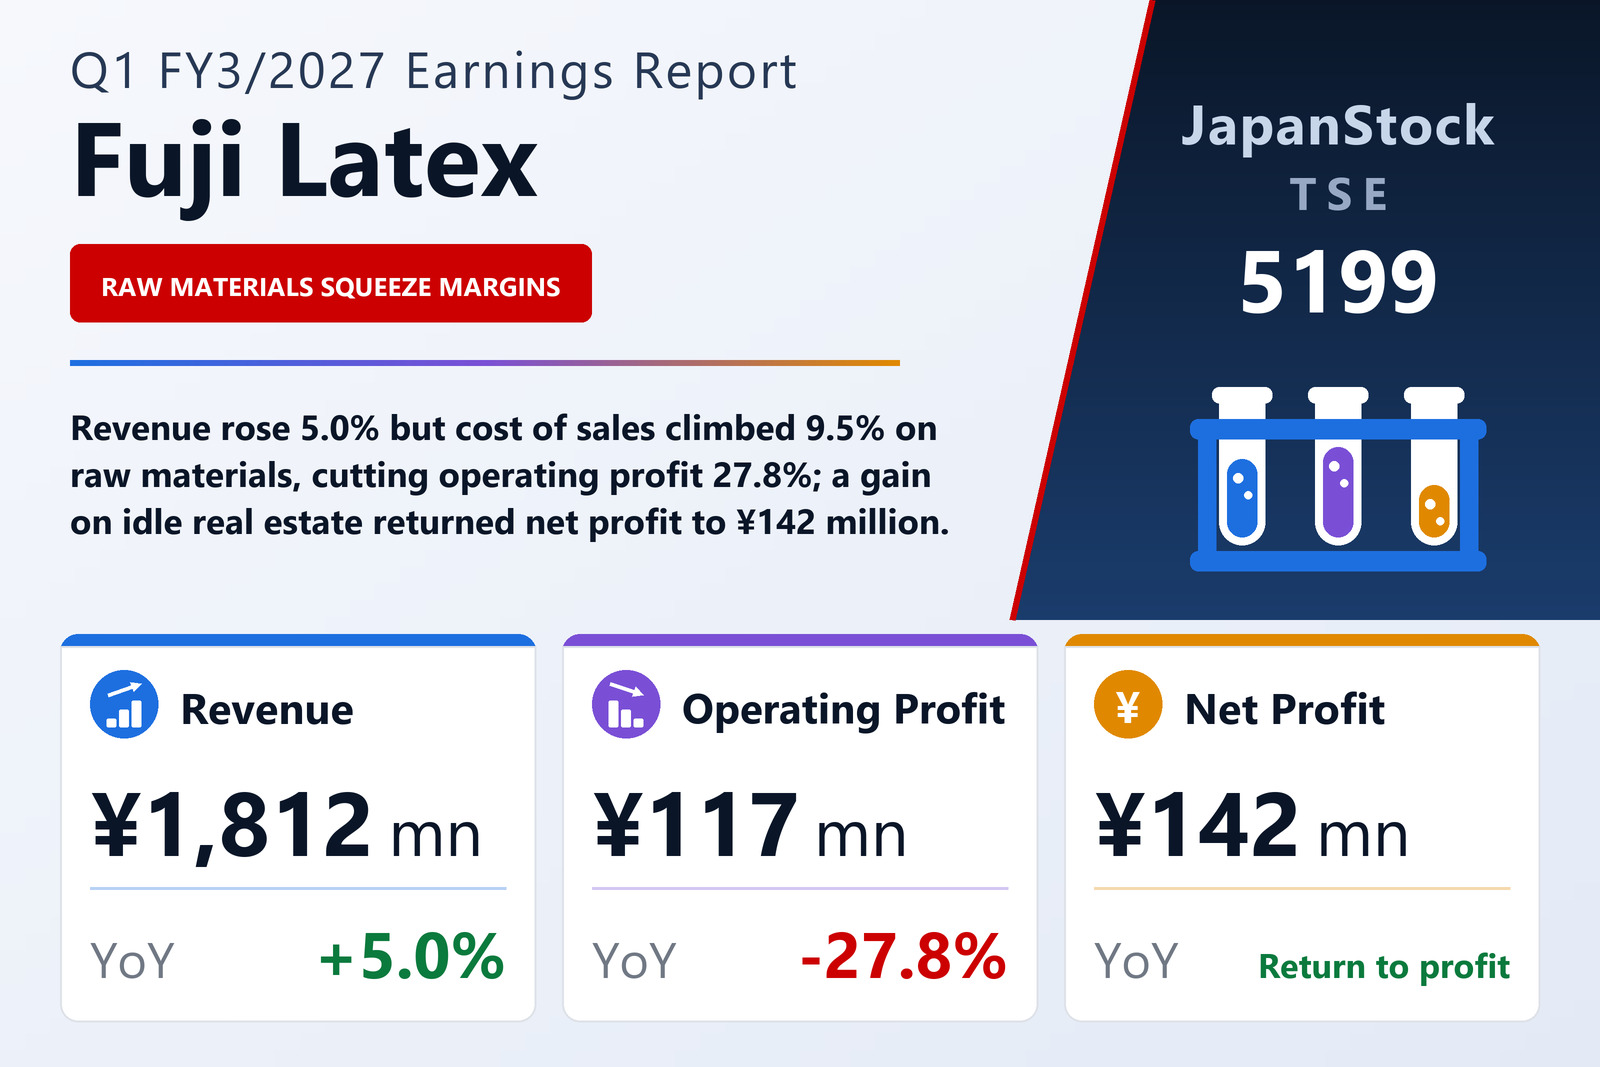
Sales grew 5.0%; operating profit fell 27.8%
Fuji Latex Co., Ltd. (TSE: 5199), whose four reporting segments cover medical devices, precision equipment, an SP business centred on film balloons, and food containers, published consolidated results for the first quarter of the fiscal year ending March 2027 — the three months from April 1 to June 30, 2026 — on August 5, 2026 under Japanese GAAP. Revenue rose 5.0% to ¥1,812 million, but operating profit fell 27.8% to ¥117 million and ordinary profit 34.5% to ¥97 million. Net profit attributable to owners of the parent was ¥142 million, against a loss of ¥5 million a year earlier, or ¥112.38 per share against a loss of ¥3.94. The quarterly statements were not reviewed by an auditor, and the company prepared no quarterly cash-flow statement.
The company says it concentrated on winning orders and expanding sales of new products, and that the precision-equipment business led the gain. The quarter's problem sat directly beneath the revenue line. Cost of sales rose 9.5% to ¥1,351 million — almost twice the rate of revenue — and the filing attributes the higher cost ratio to soaring raw-material prices, which it says outweighed the benefit of higher sales. Cost of sales absorbed 74.6% of revenue against 71.5% a year earlier, so gross profit fell 6.1% to ¥461 million even as revenue grew, and the gross margin narrowed from 28.5% to 25.4%. Selling, general and administrative expenses rose 4.7% to ¥343 million, a little slower than revenue but still higher, on top of a ¥30 million fall in gross profit: operating profit dropped by ¥45 million and the operating margin from 9.5% to 6.5%.
Higher interest and a currency loss widen the fall at the ordinary line
Ordinary profit fell further than operating profit, by 34.5% to ¥97 million, which the filing attributes to higher interest expense as rates rose and to larger foreign-exchange losses. Non-operating expenses rose to ¥26.5 million from ¥21.8 million: interest paid was ¥19.3 million against ¥16.8 million, the foreign-exchange loss ¥2.4 million against ¥0.3 million, and syndicated-loan fees ¥2.4 million against ¥1.9 million. Non-operating income slipped to ¥6.0 million from ¥7.2 million, so the net non-operating charge grew from ¥14.6 million to ¥20.5 million.
A property sale — and last year's impairment — turn the bottom line
The move from loss to profit happens below the ordinary line, and it comes from both years. This quarter the company booked an extraordinary gain of ¥45.0 million on the sale of fixed assets, which the filing links to the sale of idle real estate; land on the balance sheet fell by ¥121 million over the quarter. A year earlier the picture was the reverse: extraordinary losses of ¥149.1 million, almost all of it a ¥144.1 million impairment, mainly on land, booked in the Medical Devices segment on the closure of the company's Tochigi plant. Pre-tax profit therefore rose to ¥142 million from ¥9 million. The tax line was close to zero — current taxes of ¥16.0 million were offset by a deferred-tax credit of the same size — against ¥14.0 million a year earlier, so net profit attributable to owners of the parent matched pre-tax profit at ¥142 million. Comprehensive income was ¥148 million against a loss of ¥11 million.
Precision equipment carries the group; the two small segments lose more
Precision Equipment is by far the largest segment, with revenue of ¥1,156 million, up 3.4% — about 64% of the group — and segment profit of ¥278 million, down 1.5%. The filing says the order backlog held firm as the market recovered, but that the gain from higher sales could not absorb a higher cost ratio driven by raw materials and labour. On its own the segment earned more than twice the group's operating profit; the difference is ¥134 million of unallocated corporate costs, up from ¥124 million, plus the losses elsewhere.
Medical Devices grew fastest, with revenue up 10.7% to ¥583 million. The filing says the drag from lost condom sales after the company halted condom production has now passed, and that test kits in its healthcare range and medical products added to sales. Segment profit nonetheless fell 25.4% to ¥24 million, which the company puts down to a higher cost ratio caused partly by production yields.
The two small segments both lost more. The SP business saw revenue fall 16.5% to ¥22 million on weak sales led by film balloons, and its loss widened to ¥8 million from ¥6 million. Food Containers revenue fell 5.3% to ¥50 million, partly because new business is taking longer to generate revenue, and its loss roughly doubled to ¥42 million from ¥21 million, which the filing attributes in part to lower production efficiency while the start-up of new production equipment and a plant relocation are delayed. Together the two segments lost ¥51 million, against ¥28 million a year earlier.
Inventories and payables build; borrowings edge down
Total assets rose ¥231 million to ¥10,501 million from March 31, 2026. Cash and deposits rose ¥322 million to ¥2,588 million, and inventories built: merchandise and finished goods by ¥100 million, and raw materials and supplies by ¥158 million to ¥969 million. Notes and accounts receivable fell ¥162 million, and land ¥121 million. Liabilities rose ¥185 million to ¥6,409 million, led by a ¥211 million rise in notes and accounts payable, a ¥93 million rise in the bonus provision and ¥74 million more short-term borrowing, partly offset by a ¥101 million fall in long-term borrowings and ¥91 million less income tax payable. Short-term borrowings, bonds due within a year and long-term borrowings including the current portion together came to about ¥4,877 million, against ¥4,904 million at the year-end. Net assets rose ¥45 million to ¥4,092 million, and the equity ratio eased to 39.0% from 39.4%. Depreciation was ¥59 million, against ¥70 million a year earlier.
Guidance and dividend unchanged — and Q1 net profit already tops the half-year target
The company left its full-year forecast, published on May 15, 2026, unchanged: revenue of ¥7,500 million, up 10.3%, operating profit of ¥480 million, up 15.4%, ordinary profit of ¥383 million, up 13.4%, and net profit attributable to owners of ¥287 million, up 351.0%, or ¥226.46 per share. The first quarter delivered 24.2% of the revenue target and 24.5% of the operating-profit target. For the first half the company forecasts revenue of ¥3,635 million (+6.1%), operating profit of ¥199 million (−19.9%), ordinary profit of ¥150 million (−30.1%) and net profit of ¥128 million (+240.9%). The ¥142 million of net profit earned in the first quarter alone is already above that half-year figure, while the operating forecast implies about ¥82 million in the second quarter against ¥117 million in the first. The filing does not comment on either point.
The dividend forecast is also unchanged, at a year-end payment of ¥83.00 per share for FY3/2027 against ¥81.00 for FY3/2026. The company's economic commentary describes firm domestic demand as real wages improve, lingering inflation pressure from a weak yen even after the policy-rate rise, heightened geopolitical risk and a sense of slowdown in China.
| Metric | Q1 FY3/2027 | Q1 FY3/2026 | Change |
|---|---|---|---|
| Revenue (¥ million) | 1,812 | 1,725 | +5.0% |
| Gross profit (¥ million) | 461 | 491 | −6.1% |
| Gross margin | 25.4% | 28.5% | −3.0 pt |
| SG&A expenses (¥ million) | 343 | 327 | +4.7% |
| Operating profit (¥ million) | 117 | 163 | −27.8% |
| Operating margin | 6.5% | 9.5% | −3.0 pt |
| Ordinary profit (¥ million) | 97 | 148 | −34.5% |
| Pre-tax profit (¥ million) | 142 | 9 | +1,480.3% |
| Net profit attrib. to owners of parent (¥ million) | 142 | −5 | loss to profit |
| Comprehensive income (¥ million) | 148 | −11 | loss to profit |
| EPS (¥) | 112.38 | −3.94 | loss to profit |
| Medical Devices — revenue (¥ million) | 583 | 526 | +10.7% |
| Medical Devices — segment profit (¥ million) | 24 | 32 | −25.4% |
| Precision Equipment — revenue (¥ million) | 1,156 | 1,118 | +3.4% |
| Precision Equipment — segment profit (¥ million) | 278 | 282 | −1.5% |
| SP — revenue (¥ million) | 22 | 27 | −16.5% |
| SP — segment profit (¥ million) | −8 | −6 | loss widened |
| Food Containers — revenue (¥ million) | 50 | 53 | −5.3% |
| Food Containers — segment profit (¥ million) | −42 | −21 | loss widened |
| Total assets (¥ million) | 10,501 | 10,270 | +2.3% |
| Net assets (¥ million) | 4,092 | 4,046 | +1.1% |
| Equity ratio | 39.0% | 39.4% | −0.4 pt |
| FY3/2027 guidance — revenue (¥ million) | 7,500 | — | +10.3% |
| FY3/2027 guidance — operating profit (¥ million) | 480 | — | +15.4% |
| FY3/2027 guidance — ordinary profit (¥ million) | 383 | — | +13.4% |
| FY3/2027 guidance — net profit (¥ million) | 287 | — | +351.0% |
| FY3/2027 guidance — EPS (¥) | 226.46 | — | — |
| Annual dividend per share (¥) | 83.00 | 81.00 | +2.5% |
JapanStockPulse provides informational content only and does not constitute investment advice. Figures are taken from the company's published earnings short report and may be subject to subsequent revision.