Three different declines, and only one of them is trading
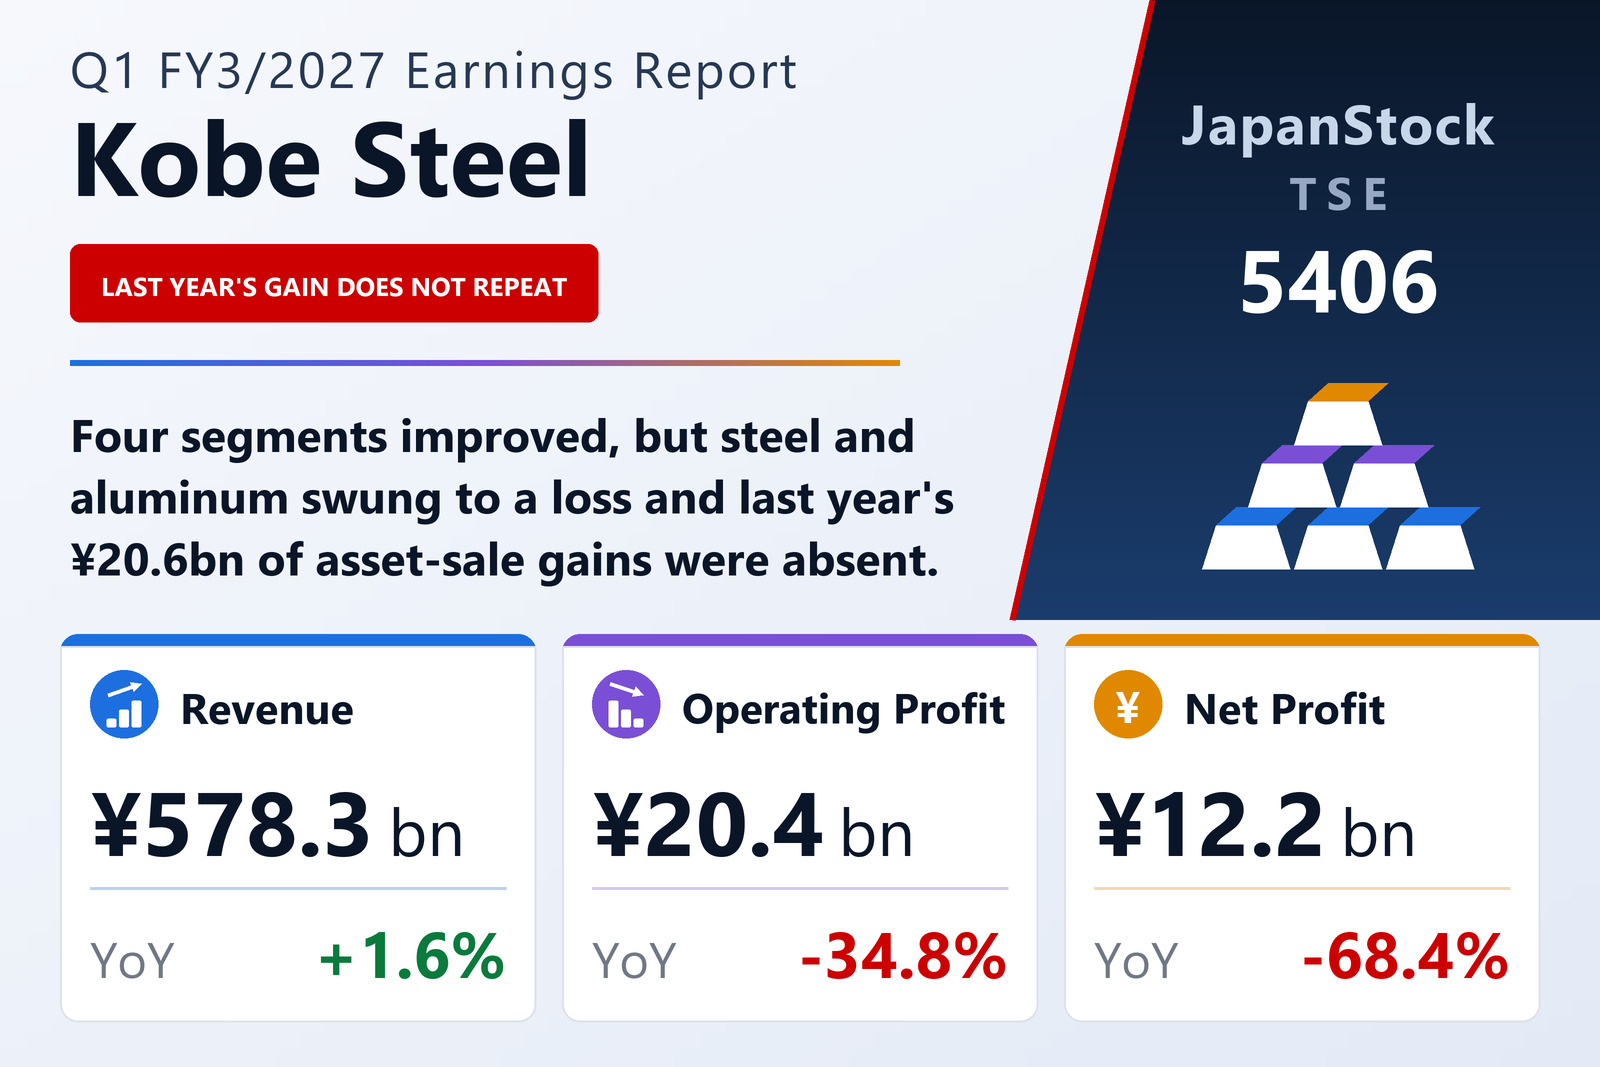
Kobe Steel, Ltd. (TSE: 5406) published consolidated results for the three months to June 30, 2026 on August 5, 2026 under Japanese GAAP. Net sales rose 1.6% to ¥578,349 million while operating profit fell 34.8% to ¥20,412 million, ordinary profit 21.2% to ¥22,663 million and net profit 68.4% to ¥12,199 million, for earnings per share of ¥30.87 against ¥98.03. Each of those three declines has a different explanation, and reading them as one number understates how much of the fall is non-operating.
The net line is the extreme case. The prior-year quarter carried ¥20,613 million of extraordinary income — a ¥6,196 million gain on the sale of fixed assets and a ¥14,417 million gain on the sale of investment securities — against extraordinary losses of ¥3,876 million. This year the equivalent income was ¥2,706 million. Pre-tax profit was ¥25,369 million against ¥45,496 million, and on top of that the effective tax rate jumped to 48.2% from 14.7%, with profit attributable to non-controlling interests at ¥932 million against ¥156 million.
The segment picture is genuinely split
Kobe Steel's segment results reconcile to ordinary profit rather than operating profit, and the revenue figures below include inter-segment sales. The core Steel & Aluminum segment is where the operating weakness sits: revenue down 3.0% to ¥250,192 million and a segment loss of ¥2,337 million against a ¥5,488 million profit.
Four segments moved the other way. Advanced Materials grew revenue 21.8% to ¥92,551 million and profit to ¥8,105 million from a near-zero ¥73 million, a comparison too distorted by its base to express as a percentage. Engineering grew revenue 22.9% to ¥39,751 million and profit 416.5% to ¥6,059 million, and Welding grew revenue 16.1% to ¥26,292 million and profit 154.0% to ¥2,334 million. Construction Machinery grew revenue 4.8% to ¥87,518 million but saw profit fall 24.2% to ¥916 million.
Against those, Machinery fell 9.7% in revenue to ¥59,772 million and 40.3% in profit to ¥6,276 million, and Electric Power fell hardest of all: revenue down 24.0% to ¥34,867 million and profit down 80.5% to ¥1,675 million from ¥8,574 million.
Guidance revised upward at the top, downward in the middle
Total assets fell 1.2% from the March year-end to ¥2,830,153 million and net assets 0.4% to ¥1,325,109 million, with the equity ratio rising to 44.4% from 44.0%.
Guidance was revised with these results. For the full year the company now guides net sales of ¥2,690,000 million (+10.4%), operating profit of ¥150,000 million (+15.5%), ordinary profit of ¥120,000 million (−1.1%) and net profit of ¥100,000 million (+6.7%), for earnings per share of ¥252.09. For the first half it guides net sales of ¥1,300,000 million (+10.0%), operating profit of ¥65,000 million (+3.9%), ordinary profit of ¥50,000 million (−13.3%) and net profit of ¥35,000 million (−44.3%), for earnings per share of ¥88.49 — the half-year net line still carrying the prior-year gain in its comparison. The quarter delivered 13.6% of the full-year operating-profit target. The annual dividend is held at ¥80.00, split ¥40.00 interim and ¥40.00 final.
| Metric | Q1 FY3/2027 | Q1 FY3/2026 | Change |
|---|---|---|---|
| Net sales (¥ million) | 578,349 | 569,056 | +1.6% |
| Operating profit (¥ million) | 20,412 | 31,305 | −34.8% |
| Operating margin | 3.5% | 5.5% | −2.0 pt |
| Ordinary profit (¥ million) | 22,663 | 28,759 | −21.2% |
| Net profit (¥ million) | 12,199 | 38,637 | −68.4% |
| EPS (¥) | 30.87 | 98.03 | −68.5% |
| Steel & Aluminum — revenue (¥ million) | 250,192 | 257,821 | −3.0% |
| Steel & Aluminum — segment profit (¥ million) | −2,337 | 5,488 | profit to loss |
| Advanced Materials — revenue (¥ million) | 92,551 | 75,966 | +21.8% |
| Advanced Materials — segment profit (¥ million) | 8,105 | 73 | n.m. |
| Welding — revenue (¥ million) | 26,292 | 22,651 | +16.1% |
| Welding — segment profit (¥ million) | 2,334 | 919 | +154.0% |
| Machinery — revenue (¥ million) | 59,772 | 66,199 | −9.7% |
| Machinery — segment profit (¥ million) | 6,276 | 10,509 | −40.3% |
| Engineering — revenue (¥ million) | 39,751 | 32,357 | +22.9% |
| Engineering — segment profit (¥ million) | 6,059 | 1,173 | +416.5% |
| Construction Machinery — revenue (¥ million) | 87,518 | 83,548 | +4.8% |
| Construction Machinery — segment profit (¥ million) | 916 | 1,208 | −24.2% |
| Electric Power — revenue (¥ million) | 34,867 | 45,861 | −24.0% |
| Electric Power — segment profit (¥ million) | 1,675 | 8,574 | −80.5% |
| Total assets (¥ million) | 2,830,153 | 2,865,184 | −1.2% |
| Net assets (¥ million) | 1,325,109 | 1,330,453 | −0.4% |
| Equity ratio | 44.4% | 44.0% | +0.4 pt |
| FY3/2027 guidance — revenue (¥ million) | 2,690,000 | — | +10.4% |
| FY3/2027 guidance — operating profit (¥ million) | 150,000 | — | +15.5% |
| FY3/2027 guidance — ordinary profit (¥ million) | 120,000 | — | −1.1% |
| FY3/2027 guidance — net profit (¥ million) | 100,000 | — | +6.7% |
| FY3/2027 guidance — EPS (¥) | 252.09 | — | n.m. |
| Annual dividend per share (¥) | 80.00 | 80.00 | unchanged |
JapanStockPulse provides informational content only and does not constitute investment advice. Figures are taken from the company's published earnings short report and may be subject to subsequent revision.