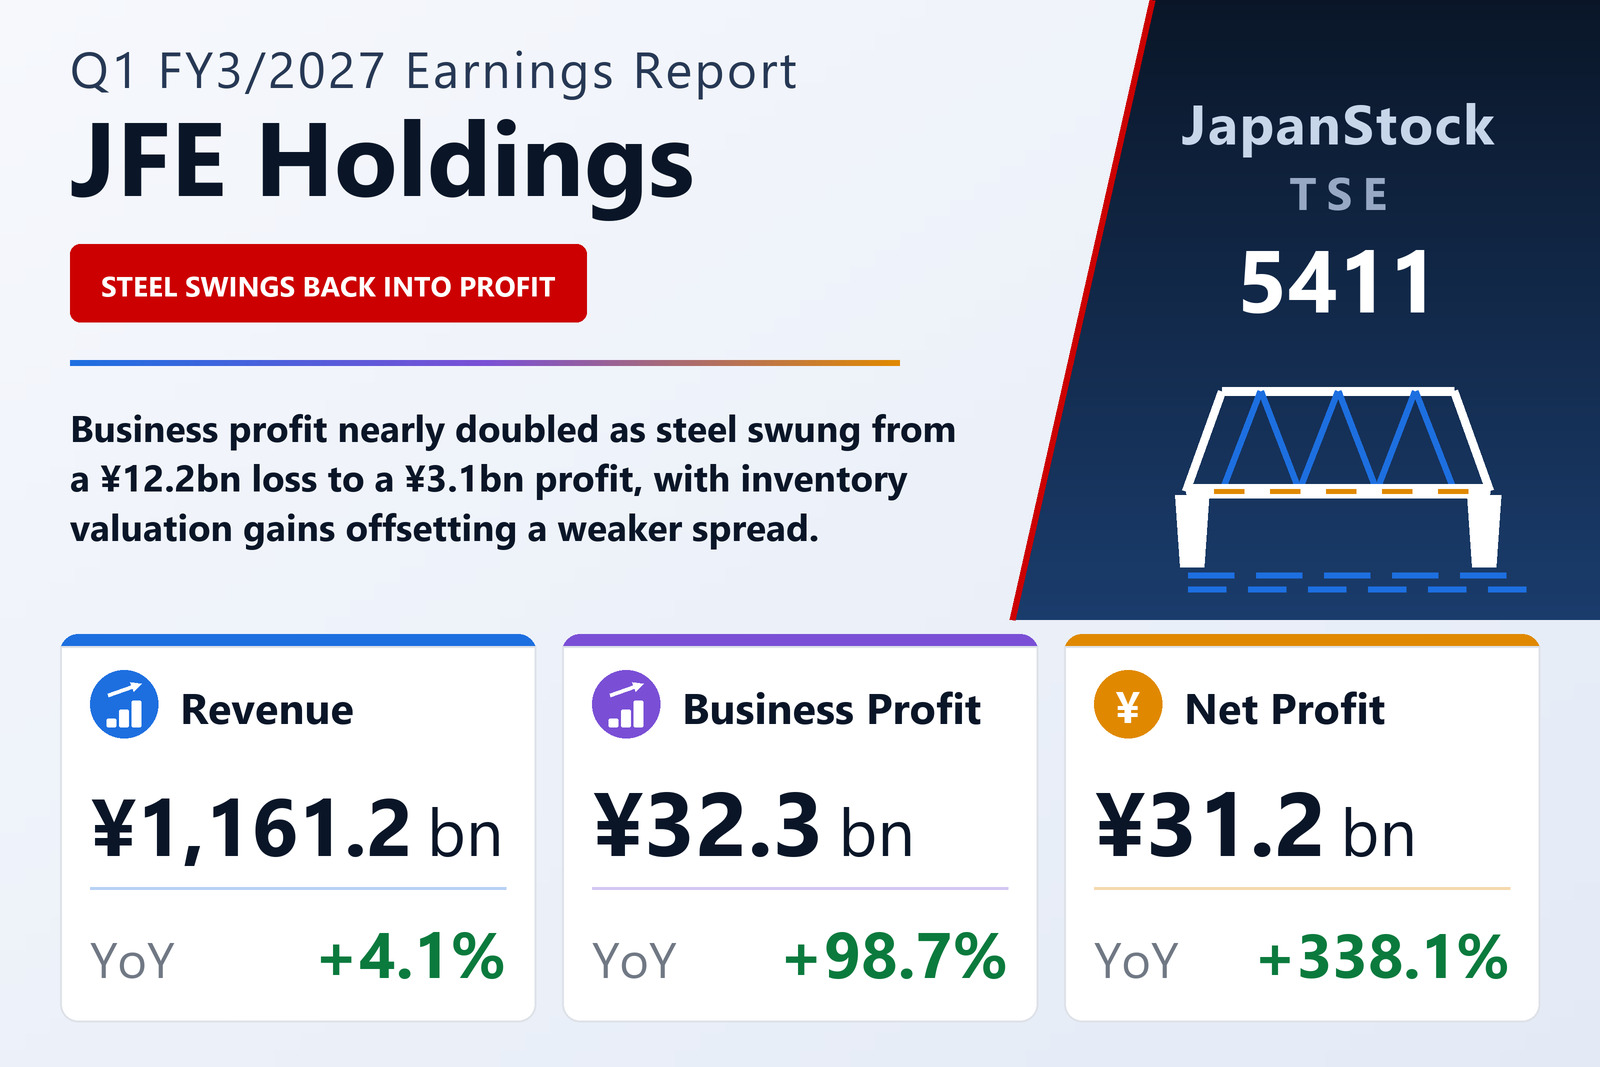
A 4.1% revenue gain, a 98.7% business-profit gain
JFE Holdings, Inc. (TSE: 5411), the holding company for three operating companies — JFE Steel, JFE Engineering and JFE Shoji — published consolidated results for the first quarter of FY3/2027, the three months from April 1 to June 30, 2026, on August 5, 2026 under IFRS. Revenue rose 4.1% to ¥1,161,178 million, business profit 98.7% to ¥32,313 million, operating profit 191.2% to ¥47,360 million, pre-tax profit 295.0% to ¥40,985 million and profit attributable to owners of the parent 338.1% to ¥31,229 million, for basic earnings of ¥49.09 per share against ¥11.21. The filing lists the shares on the Tokyo Stock Exchange.
Business profit is the company's own representative indicator: pre-tax profit before finance income and costs and before one-off items of material size. Its ¥16,052 million increase can be traced line by line. Cost of sales rose 3.5% to ¥1,037,136 million, a little slower than revenue, so gross profit grew 9.1% to ¥124,041 million and the gross margin widened from 10.2% to 10.7%, adding ¥10,314 million. Selling, general and administrative expenses rose 3.1% to ¥105,496 million, taking back ¥3,133 million. Share of profit of equity-method investees climbed to ¥19,204 million from ¥12,996 million, adding ¥6,208 million, and other expenses fell to ¥11,794 million from ¥15,270 million while other income eased to ¥6,358 million from ¥7,171 million. Even so, the business-profit margin was only 2.8%, against 1.5% a year earlier.
A land gain, higher finance costs and a heavier tax charge below the headline line
Operating profit of ¥47,360 million is business profit plus a ¥15,046 million gain on the sale of land, a line that did not exist a year earlier; the filing does not say which site it relates to. Finance costs rose to ¥7,334 million from ¥6,882 million against finance income of ¥959 million, so net finance costs widened to ¥6,375 million from ¥5,885 million and pre-tax profit came to ¥40,985 million. Income tax expense was ¥8,717 million against ¥2,601 million, leaving quarterly profit of ¥32,267 million, of which ¥1,038 million went to non-controlling interests. Comprehensive income swung to ¥46,131 million from a loss of ¥26,290 million: other comprehensive income was a gain of ¥13,863 million against a loss of ¥34,066 million, chiefly because foreign-currency translation differences turned to +¥7,738 million from −¥7,875 million and the equity-method share of reclassifiable items to +¥1,655 million from −¥19,461 million.
Steel is back in profit, but the spread got worse
Segment revenue below includes intersegment sales. Steel, by far the largest business, was flat at ¥763,584 million, up 0.3%, but its segment profit — pre-tax profit before one-off items — moved to ¥3,051 million from a loss of ¥12,150 million. Engineering grew revenue 8.9% to ¥147,382 million and segment profit 55.4% to ¥8,940 million. Trading grew revenue fastest, 12.4% to ¥380,683 million, yet its segment profit fell 10.2% to ¥11,332 million. The three segments earned ¥23,324 million between them against ¥6,216 million; adjustments of ¥2,614 million, including ¥2,029 million of equity-method profit from Japan Marine United, bring the total to ¥25,938 million before the land gain.
The company's bridge for the steel segment's roughly ¥15.1 billion improvement shows that it did not come from better steel economics. Cost reductions from operational improvements added about ¥7.0 billion and volume and mix contributed nothing, with non-consolidated crude steel output edging down to 5.25 million tonnes from 5.28 million. The spread — selling prices less raw-material and other costs — subtracted about ¥45.0 billion, which the company attributes to deteriorating domestic and overseas steel market conditions, soaring main raw-material prices and roughly ¥15 billion of cost increases linked to the Middle East situation, group companies included. Against that, inventory valuation and related effects added about ¥47.0 billion (inventory valuation differences +¥36 billion, carry-over effects +¥4 billion, currency translation +¥7 billion), and other items added ¥6.1 billion, mostly group companies, where overseas affiliates contributed +¥5 billion and India +¥7 billion within that. Engineering, trading and adjustments together added about ¥0.5 billion.
The operating statistics point the same way. Consolidated crude steel output was 5.56 million tonnes against 5.61 million, non-consolidated steel shipments 4.54 million tonnes against 4.71 million, and the export ratio 39.3% against 39.9% by value. The average steel selling price rose to ¥124,200 per tonne from ¥120,400, and the yen averaged ¥159.9 to the dollar against ¥145.3.
Borrowings up ¥352.7 billion in a quarter; equity ratio down to 42.6%
Total assets rose 4.9% to ¥6,185,920 million from ¥5,895,238 million at March 31, 2026. Investments accounted for by the equity method grew to ¥958,483 million from ¥816,153 million, an increase of ¥142,330 million the filing does not explain, and inventories rose to ¥1,224,868 million from ¥1,188,142 million. Bonds, borrowings and lease liabilities rose 18.0% to ¥2,312,087 million, with the current portion jumping to ¥786,124 million from ¥443,307 million. In the quarter the company prepaid a ¥167.5 billion subordinated loan taken out on June 30, 2016 and raised ¥60 billion of subordinated bonds on June 11, 2026 and a ¥105 billion subordinated loan on June 30, 2026, which rating agencies credit as 50% equity. Equity attributable to owners of the parent rose only 0.6% to ¥2,635,917 million, as quarterly profit of ¥31,229 million was largely offset by ¥25,488 million of dividends, so the equity ratio fell from 44.4% to 42.6%. No quarterly cash-flow statement was prepared; depreciation and amortisation was ¥68,207 million against ¥66,779 million. One equity-method associate, a manganese-alloy producer in Inner Mongolia, left the scope of consolidation.
Revenue guidance raised, profit guidance held
JFE Holdings revised its FY3/2027 forecast only at the top line: revenue is now expected to reach ¥4,850,000 million (+6.8%), against ¥4,800,000 million in the May 8 outlook. Business profit of ¥215,000 million (+58.8%), pre-tax profit of ¥190,000 million (+117.3%), profit attributable to owners of ¥150,000 million (+113.8%) and earnings of ¥235.80 per share are unchanged. For the first half it guides to revenue of ¥2,380,000 million (+6.6%), business profit of ¥90,000 million (+96.7%) and net profit of ¥65,000 million (+143.7%). The first quarter therefore delivered 35.9% of the half-year and 15.0% of the full-year business-profit target, implying about ¥57,687 million in the second quarter alone. The full-year pre-tax figure includes ¥15 billion of one-off items, and the plan puts steel segment profit at ¥100 billion for the year against ¥3.1 billion in the first quarter.
The weight falls on the second half. The company's own bridge from a first-half segment profit of ¥70 billion to ¥105 billion in the second half has steel adding ¥40 billion, driven by a ¥59 billion spread improvement it ties to efforts to raise steel prices, partly offset by ¥30 billion of reversing inventory-valuation effects. It assumes the yen at about ¥160 to the dollar for the rest of the year. The dividend forecast is ¥40.00 at the interim and ¥40.00 at the year-end, for an annual ¥80.00, matching FY3/2026 and equal to about 34% of guided earnings per share; the summary page marks the forecast as revised from the most recent announcement without showing the earlier figure.
After the quarter: a ¥45 billion land sale spread over nine years
On August 5, 2026 JFE Steel signed an agreement to sell 181,976 square metres of land at Ohgishima, Kawasaki-ku, Kawasaki, Kanagawa Prefecture — idle land that had served as a raw-material yard at the Keihin district of its East Japan Works. The sale is part of converting land use at the site, including the creation of a next-generation logistics hub, and is meant to fund further conversion investment. The price and the buyer, a domestic company with no reportable relationship to JFE, are undisclosed. The company estimates the total gain at about ¥45 billion, booked across four transfers: about ¥23 billion in the year to March 2028, when the first transfer of 89,414 square metres is due, then about ¥9 billion, ¥9 billion and ¥4 billion with the remaining transfers in December 2033, December 2034 and December 2035.
| Metric | Q1 FY3/2027 | Q1 FY3/2026 | Change |
|---|---|---|---|
| Revenue (¥ million) | 1,161,178 | 1,115,313 | +4.1% |
| Gross profit (¥ million) | 124,041 | 113,727 | +9.1% |
| Gross margin | 10.7% | 10.2% | +0.5 pt |
| SG&A expenses (¥ million) | 105,496 | 102,363 | +3.1% |
| Business profit (¥ million) | 32,313 | 16,261 | +98.7% |
| Operating profit (¥ million) | 47,360 | 16,261 | +191.2% |
| Pre-tax profit (¥ million) | 40,985 | 10,377 | +295.0% |
| Net profit attrib. to owners of parent (¥ million) | 31,229 | 7,128 | +338.1% |
| Comprehensive income (¥ million) | 46,131 | −26,290 | n.m. |
| EPS (¥) | 49.09 | 11.21 | +337.9% |
| Steel — revenue (¥ million) | 763,584 | 761,219 | +0.3% |
| Steel — segment profit (¥ million) | 3,051 | −12,150 | loss to profit |
| Engineering — revenue (¥ million) | 147,382 | 135,361 | +8.9% |
| Engineering — segment profit (¥ million) | 8,940 | 5,752 | +55.4% |
| Trading — revenue (¥ million) | 380,683 | 338,736 | +12.4% |
| Trading — segment profit (¥ million) | 11,332 | 12,614 | −10.2% |
| Total assets (¥ million) | 6,185,920 | 5,895,238 | +4.9% |
| Equity attrib. to owners of parent (¥ million) | 2,635,917 | 2,619,535 | +0.6% |
| Equity ratio | 42.6% | 44.4% | −1.8 pt |
| Bonds, borrowings and lease liabilities (¥ million) | 2,312,087 | 1,959,385 | +18.0% |
| FY3/2027 guidance — revenue (¥ million) | 4,850,000 | — | +6.8% |
| FY3/2027 guidance — business profit (¥ million) | 215,000 | — | +58.8% |
| FY3/2027 guidance — pre-tax profit (¥ million) | 190,000 | — | +117.3% |
| FY3/2027 guidance — net profit (¥ million) | 150,000 | — | +113.8% |
| FY3/2027 guidance — EPS (¥) | 235.80 | — | — |
| Annual dividend per share (¥) | 80.00 | 80.00 | unchanged |
JapanStockPulse provides informational content only and does not constitute investment advice. Figures are taken from the company's published earnings short report and may be subject to subsequent revision.