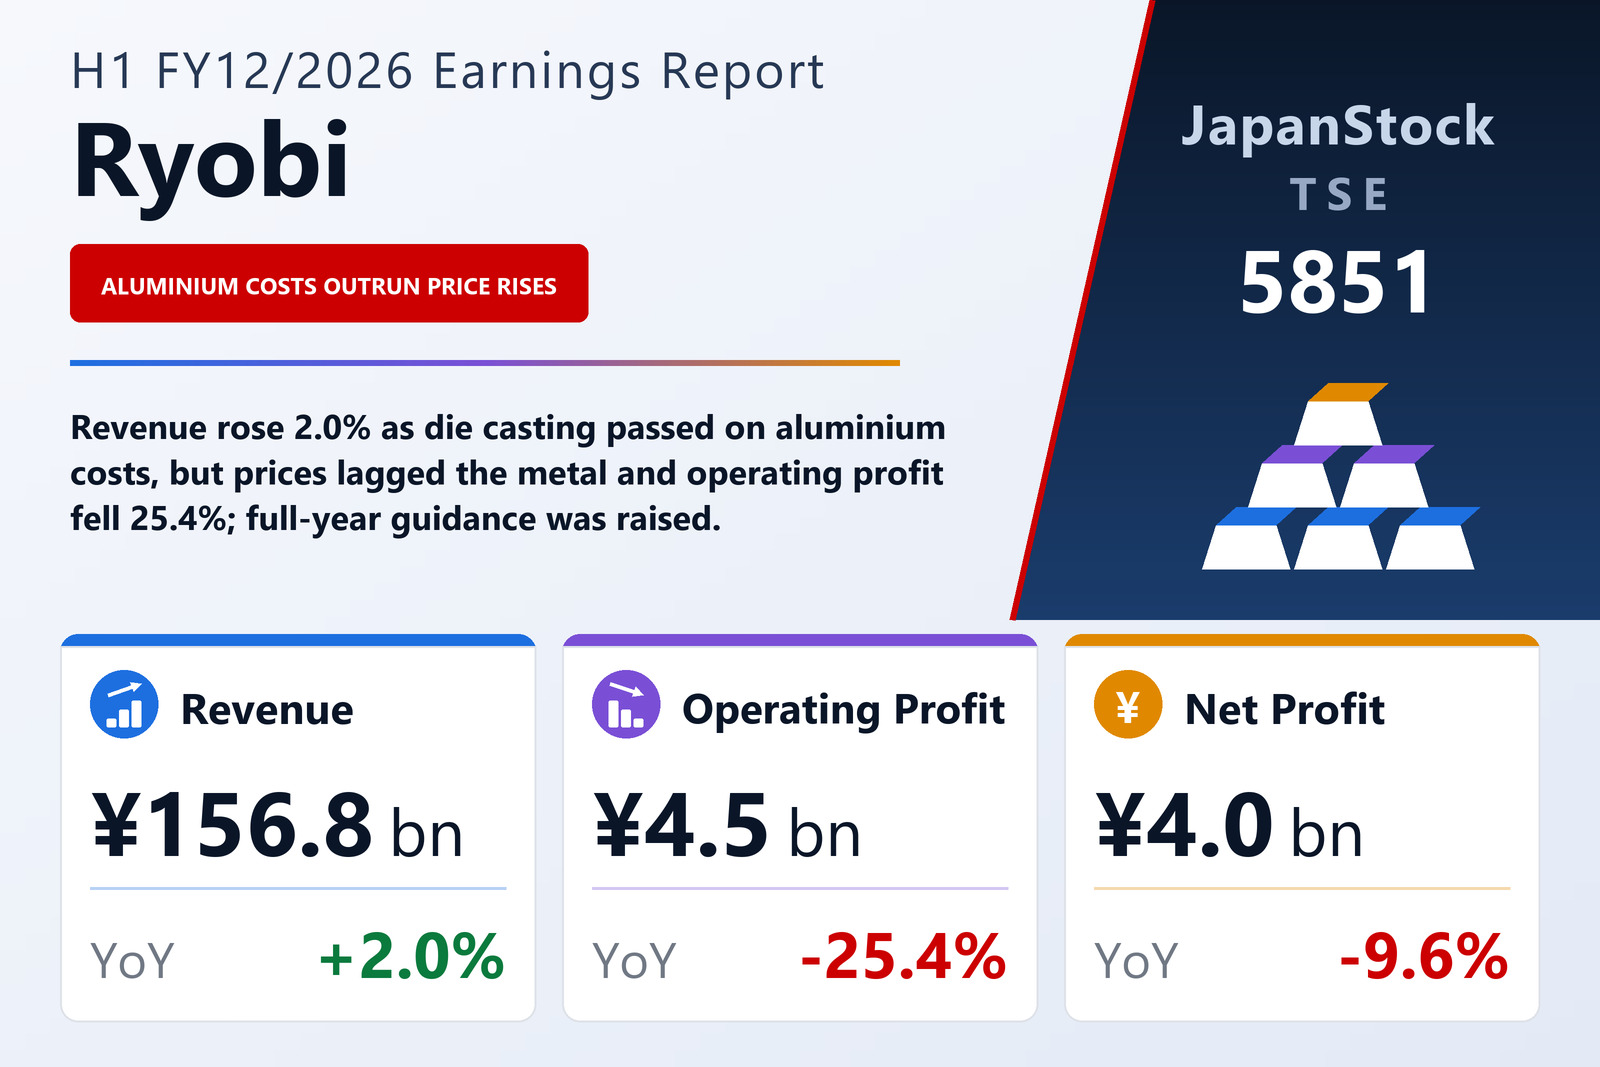
Revenue edged up 2.0%, cost of sales rose 3.8% — and that gap took a quarter off operating profit
Ryobi Limited (TSE: 5851), the die-casting group that also makes builders' hardware and printing equipment, published consolidated first-half results for the six months from January 1 to June 30, 2026 on August 5, 2026 under Japanese GAAP. Revenue rose 2.0% to ¥156,773 million, while operating profit fell 25.4% to ¥4,454 million, ordinary profit 20.7% to ¥4,834 million and profit attributable to owners of the parent 9.6% to ¥4,003 million, for earnings of ¥125.87 per share against ¥136.78. The company is listed on the Tokyo Stock Exchange, and the filing notes that the interim report was not reviewed by an auditor.
Two spreads moved the wrong way at once. Cost of sales rose 3.8% to ¥139,916 million against revenue growth of 2.0%, so gross profit fell 11.3% to ¥16,857 million and the gross margin narrowed from 12.4% to 10.8%. Selling, general and administrative expenses fell 4.8% to ¥12,402 million, recovering ¥626 million of the ¥2,147 million lost at the gross line; the filing gives no breakdown of that saving. The operating margin slipped from 3.9% to 2.8%. The company describes an unstable environment shaped by high resource and energy prices and by the trade policies of various countries, and says it pushed sales while pursuing cost reduction, productivity gains and more efficient operations.
Below the operating line, a securities sale softened the fall
Non-operating items helped a little more than a year earlier. Non-operating income rose to ¥1,343 million from ¥1,207 million, including a foreign-exchange gain of ¥118 million against a loss of ¥211 million, while non-operating expenses fell to ¥963 million from ¥1,089 million even as interest expense rose to ¥778 million from ¥698 million. Ordinary profit therefore fell less steeply than operating profit, by 20.7% to ¥4,834 million. Extraordinary items did more of the cushioning: a ¥1,023 million gain on sales of investment securities, against ¥143 million a year earlier, lifted extraordinary income to ¥1,058 million, while extraordinary losses of ¥194 million included a ¥134 million write-down of investment securities. Profit before income taxes was ¥5,697 million, down 8.4%.
Income taxes rose to ¥1,712 million from ¥1,457 million, so interim profit fell 16.3% to ¥3,985 million. Profit attributable to owners of the parent came in above that total, at ¥4,003 million, because non-controlling interests bore a loss of ¥18 million against a profit of ¥335 million a year earlier — which is why the bottom line fell only 9.6%. Earnings per share fell a smaller 8.0% because the average number of shares was 31,809,471 against 32,368,252. Comprehensive income swung to ¥9,770 million from a loss of ¥3,461 million, driven mainly by a foreign-currency translation adjustment of +¥5,082 million against −¥7,951 million a year earlier.
Die casting grew on price pass-through and the weak yen, but the aluminium lag cut its profit
Die casting is nearly the whole group: ¥143,310 million of revenue, up 6.2%, or 91.4% of the total against 87.8% a year earlier. The filing says production volume fell slightly, but higher aluminium raw-material prices were passed on to selling prices and the weaker yen raised the yen value of overseas subsidiaries' sales, so revenue grew both in Japan and overseas. Segment profit nonetheless fell 7.0% to ¥4,700 million, and its margin from 3.7% to 3.3%. The company's explanation is timing: despite cost reduction and productivity gains, aluminium prices kept rising sharply, and passing an increase on to selling prices takes a certain period. Part of the revenue growth is therefore metal cost recharged to customers rather than extra volume, and the recharge arrives after the cost.
The two smaller segments both slipped into loss. Builders' hardware revenue fell 5.5% to ¥5,081 million, lower in Japan and overseas, and the segment moved to a loss of ¥185 million from a profit of ¥16 million: a stronger Chinese yuan raised the cost of procuring from China, where its production bases are, and cost reduction and expense savings did not make up the difference. Printing equipment took the heaviest blow, with revenue down 37.8% to ¥8,253 million, which the filing attributes to weaker appetite for capital investment amid an uncertain outlook, in Japan and overseas alike; lower revenue turned a ¥935 million profit into a ¥38 million loss. Printing equipment's ¥973 million profit decline was larger than die casting's ¥352 million and builders' hardware's ¥202 million combined. The supplementary data show domestic revenue rising to ¥69,314 million from ¥66,171 million, while overseas revenue was essentially flat at ¥87,459 million against ¥87,574 million.
Inventories rose, borrowings fell and the equity ratio climbed to 54.3%
Total assets were ¥345,613 million at June 30, 2026, up 0.5% from December 31, 2025. Inventories rose by ¥6,417 million — work in process to ¥22,002 million from ¥18,125 million, raw materials and supplies to ¥24,049 million from ¥21,620 million — while cash and deposits fell ¥4,185 million to ¥26,968 million. Liabilities fell ¥6,163 million to ¥148,020 million, chiefly because borrowings were reduced by ¥5,490 million, leaving interest-bearing debt, excluding discounted notes and lease obligations, at ¥69,251 million against ¥74,742 million. Net assets rose 4.2% to ¥197,592 million, mostly on a ¥5,082 million rise in the foreign-currency translation adjustment, ¥2,413 million in retained earnings and ¥959 million in the valuation difference on securities. Shareholders' equity of ¥187,738 million lifted the equity ratio from 52.2% to 54.3%.
Operating cash flow was ¥7,487 million, up ¥3,203 million, supported by depreciation of ¥9,714 million and much lower income taxes paid, ¥811 million against ¥3,990 million, against a ¥5,102 million increase in inventories. The investing outflow shrank to ¥4,672 million from ¥13,087 million, largely because purchases of property, plant and equipment fell to ¥6,707 million from ¥11,397 million. Financing activities used ¥8,032 million, against an inflow of ¥4,210 million a year earlier, as borrowings were reduced by ¥6,122 million and ¥1,590 million was paid in dividends. Cash and cash equivalents ended the half at ¥22,594 million, down ¥4,697 million.
Guidance raised on pass-through and the yen, with the second half expected broadly as planned
Ryobi revised the full-year FY12/2026 guidance it had published on February 12, 2026. It now expects revenue of ¥340,000 million, up from ¥313,000 million and +10.0% on FY12/2025; operating profit of ¥13,000 million, up from ¥12,800 million and +2.6%; ordinary profit of ¥14,000 million, up from ¥13,300 million but −4.2%; and profit attributable to owners of ¥12,000 million, up from ¥11,500 million and +7.3%, for earnings per share of ¥377.25. The higher revenue rests on further progress in passing aluminium price increases through to die-casting selling prices and on the weak yen lifting the translated sales of overseas subsidiaries, even though production volume is now expected to be slightly below the previous forecast. On profit, the company expects the second half to run broadly in line with its earlier plan and has raised the full-year figures because the first half beat it.
That leaves a heavily back-loaded year. The first half delivered 46.1% of guided revenue but only 34.3% of guided operating profit, so the guidance implies second-half operating profit of about ¥8,546 million, nearly double the ¥4,454 million just reported and above the roughly ¥6,690 million implied for the second half of FY12/2025. By segment, the supplementary data guide die casting to ¥12,500 million of full-year operating profit, implying about ¥7,800 million in the second half, and builders' hardware and printing equipment to ¥200 million and ¥300 million, so both are expected to end the year in profit. Exchange-rate assumptions from the third quarter are ¥155 to the US dollar, ¥210 to the pound, ¥23.0 to the yuan and ¥4.7 to the Thai baht, and the plan calls for capital expenditure of ¥20,000 million and depreciation of ¥19,000 million.
The dividend forecast was revised as well. Ryobi has set an interim dividend of ¥52.00 against ¥50.00, payable from September 1, 2026, and now forecasts a year-end dividend of ¥54.00 against ¥50.00, for an annual ¥106.00 against ¥100.00, up 6.0% and about 28% of guided earnings per share. The filing does not restate the previous dividend forecast.
| Metric | H1 FY12/2026 | H1 FY12/2025 | Change |
|---|---|---|---|
| Revenue (¥ million) | 156,773 | 153,745 | +2.0% |
| Gross profit (¥ million) | 16,857 | 19,004 | −11.3% |
| Gross margin | 10.8% | 12.4% | −1.6 pt |
| SG&A expenses (¥ million) | 12,402 | 13,028 | −4.8% |
| Operating profit (¥ million) | 4,454 | 5,975 | −25.4% |
| Operating margin | 2.8% | 3.9% | −1.1 pt |
| Ordinary profit (¥ million) | 4,834 | 6,093 | −20.7% |
| Net profit attrib. to owners of parent (¥ million) | 4,003 | 4,427 | −9.6% |
| Comprehensive income (¥ million) | 9,770 | −3,461 | loss to profit |
| EPS (¥) | 125.87 | 136.78 | −8.0% |
| Die Casting — revenue (¥ million) | 143,310 | 134,979 | +6.2% |
| Die Casting — segment profit (¥ million) | 4,700 | 5,053 | −7.0% |
| Builders' Hardware — revenue (¥ million) | 5,081 | 5,377 | −5.5% |
| Builders' Hardware — segment profit (¥ million) | −185 | 16 | profit to loss |
| Printing Equipment — revenue (¥ million) | 8,253 | 13,278 | −37.8% |
| Printing Equipment — segment profit (¥ million) | −38 | 935 | profit to loss |
| Total assets (¥ million) | 345,613 | 343,734 | +0.5% |
| Net assets (¥ million) | 197,592 | 189,550 | +4.2% |
| Equity ratio | 54.3% | 52.2% | +2.1 pt |
| Interest-bearing debt (¥ million) | 69,251 | 74,742 | −7.3% |
| Operating cash flow (¥ million) | 7,487 | 4,284 | +74.8% |
| FY12/2026 guidance — revenue (¥ million) | 340,000 | 309,111 | +10.0% |
| FY12/2026 guidance — operating profit (¥ million) | 13,000 | 12,665 | +2.6% |
| FY12/2026 guidance — ordinary profit (¥ million) | 14,000 | 14,620 | −4.2% |
| FY12/2026 guidance — net profit (¥ million) | 12,000 | 11,182 | +7.3% |
| FY12/2026 guidance — EPS (¥) | 377.25 | 346.41 | +8.9% |
| Annual dividend per share (¥) | 106.00 | 100.00 | +6.0% |
JapanStockPulse provides informational content only and does not constitute investment advice. Figures are taken from the company's published earnings short report and may be subject to subsequent revision.