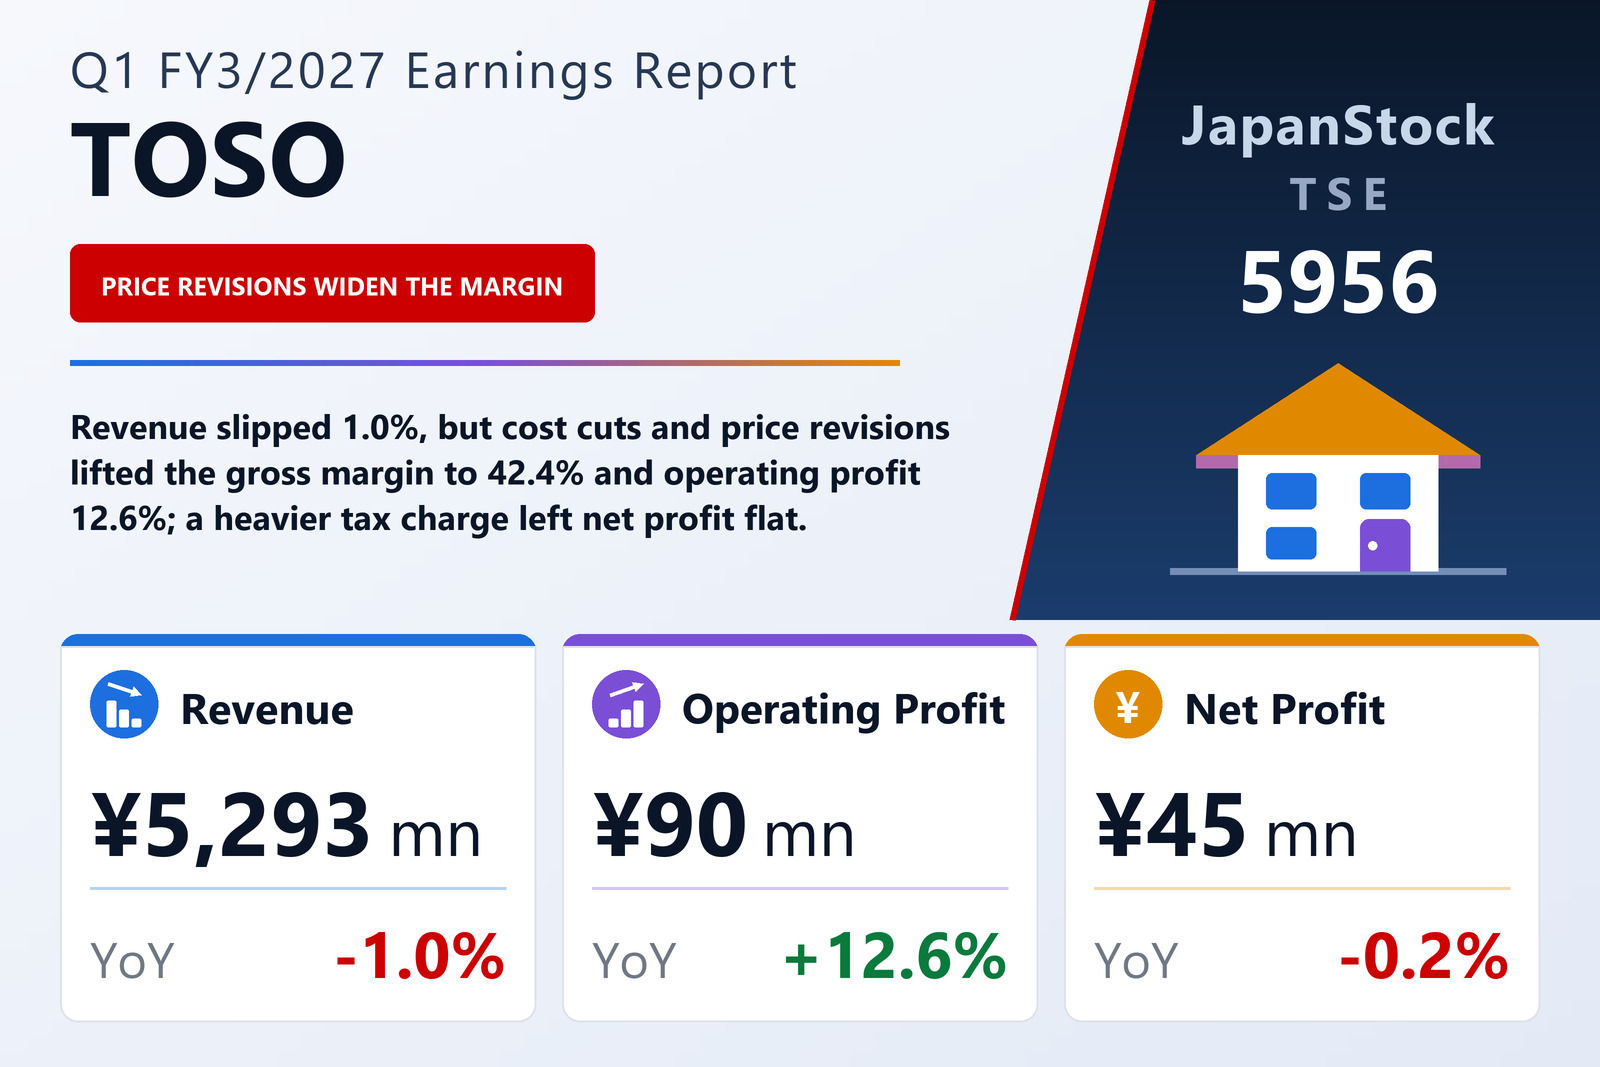
A 1.0% sales dip, a 12.6% rise in operating profit
TOSO Co., Ltd. (TSE: 5956), which makes window-covering and other interior-furnishing products for homes and non-residential buildings, published consolidated results for the first quarter of FY3/2027 — the three months from April 1 to June 30, 2026 — on August 5, 2026 under Japanese GAAP. Revenue fell 1.0% to ¥5,293 million, while operating profit rose 12.6% to ¥90 million and ordinary profit 29.4% to ¥121 million. Profit attributable to owners of the parent was ¥45 million, down 0.2%, yet earnings per share edged up to ¥5.14 from ¥5.13 because the average share count was lower. The company is listed on the Tokyo Stock Exchange, and its quarterly statements were reviewed by its auditor on a voluntary basis.
The operating result is a story of small numbers moving the right way. Revenue was ¥54 million lower than a year earlier, but cost of sales fell faster, by 1.8% to ¥3,048 million, so gross profit was essentially unchanged at ¥2,245 million (+0.1%) and the gross margin widened from 41.9% to 42.4%. The company says rising raw-material prices and currency movements weighed on costs, but cost-reduction work and price revisions more than offset them. Selling, general and administrative expenses slipped 0.3% to ¥2,154 million: advertising fell from ¥182.1 million to ¥99.5 million, which the filing attributes to the fall-off after last year's advertising around a price revision, while employee salaries rose from ¥658.0 million to ¥679.7 million and bonuses from ¥114.4 million to ¥144.5 million. Put together, gross profit rose by ¥3.3 million and SG&A fell by ¥6.9 million, which is the whole of the ¥10.1 million gain in operating profit. The operating margin moved from 1.5% to 1.7% — a thin margin either way.
Below the operating line, non-operating gains lifted ordinary profit and taxes took it back
Non-operating items added a net ¥31 million, up 129.8% on a year earlier. The filing points chiefly to a ¥9.0 million gain on the cancellation of leases when a group company moved its office; the statements also show a foreign-exchange gain of ¥1.8 million against a ¥6.5 million loss a year earlier and dividend income of ¥23.4 million against ¥18.9 million, partly offset by interest expense of ¥12.5 million against ¥7.7 million. Ordinary profit therefore rose 29.4% to ¥121 million. Extraordinary items were a net loss of about ¥1 million, mainly ¥1.4 million of losses on the disposal of fixed assets, and pre-tax profit was ¥120 million, up 29.1%.
That gain did not reach the bottom line. Income taxes rose 68.4% to ¥73.9 million, equal to 61.4% of pre-tax profit against 47.0% a year earlier; TOSO computes quarterly tax by applying an estimated full-year effective rate to pre-tax profit, and the filing gives no further explanation of the heavier charge. Quarterly profit was ¥46.6 million, down 5.9%, and after ¥1.2 million attributable to non-controlling interests (¥3.9 million a year earlier) profit attributable to owners of the parent came to ¥45 million, down 0.2%. Earnings per share still rose, to ¥5.14, because the average number of shares outstanding fell to 8,837,226 from 8,869,318. Comprehensive income swung to ¥205 million from a loss of ¥151 million: other comprehensive income was +¥159.1 million against −¥200.5 million, as valuation gains on securities of ¥116.5 million, deferred hedge gains of ¥8.0 million (−¥104.4 million a year earlier) and translation gains of ¥37.0 million (−¥97.4 million) all ran the other way from last year.
Housing and overseas sales held up; non-residential did not
The filing describes a construction market moving in two directions. New housing starts, which had fallen back after a rush of demand ahead of revisions to the Building Standards Act and the Building Energy Efficiency Act, have started to recover, while the floor area of non-residential construction starts kept trending down. In the final year of the third phase of its Vision2025 plan (FY2024–FY2026), TOSO says it pushed deeper into its core housing market, pursued non-residential work centred on lodging and medical facilities, broadened existing products into new applications, strengthened overseas sales including luxury hotels, and worked on new business areas. The result was mixed: sales in the core domestic housing market and overseas were strong, but domestic non-residential sales and the push into new applications stalled, and revenue fell 1.0%.
The Interior Decoration business, about 97.6% of revenue, recorded sales of ¥5,164 million, down 0.9%: new housing products and large overseas projects contributed, but domestic non-residential sales declined against the prior year. Segment profit rose 29.0% to ¥86 million, which the company attributes to price revisions phased in since the fiscal year before last. In June it launched a light-control curtain that people can walk through while it is closed, added heat-shielding fabrics to its light-control roll screens ahead of the summer heat, and from May held a nationwide "Style Up" exhibition to promote the new products. The Other business, which sells welfare products such as walking sticks, had sales of ¥128 million, down 5.2% on lower sales to existing customers, and its profit fell 71.5% to ¥3 million as lower sales combined with higher costs from currency movements. The filing shows no reconciling adjustment between the two segments' profits and consolidated operating profit.
Receivables fell, inventories rose and the equity ratio climbed
Total assets fell ¥264 million to ¥22,805 million from March 31, 2026. Notes and accounts receivable dropped from ¥3,929 million to ¥3,134 million, while merchandise and finished goods rose from ¥1,580 million to ¥1,787 million and raw materials and supplies from ¥2,390 million to ¥2,590 million. Liabilities fell ¥374 million to ¥6,844 million, led by accrued expenses (¥719 million to ¥456 million) and income taxes payable (¥222 million to ¥88 million), while short-term borrowings rose from ¥2,718 million to ¥2,839 million. Net assets rose ¥110 million to ¥15,960 million, chiefly on higher valuation gains on securities, and the equity ratio improved from 68.3% to 69.6%; the current ratio was 297.0% against 291.3%. TOSO did not prepare a quarterly cash-flow statement; depreciation and amortisation was ¥130 million against ¥149 million.
Full-year guidance and a lower dividend forecast stand unchanged
TOSO left its full-year FY3/2027 guidance unchanged from the figures published with its FY3/2026 results on May 13, 2026: revenue of ¥23,500 million (+1.1%), operating profit of ¥850 million (−11.0%), ordinary profit of ¥870 million (−11.5%) and profit attributable to owners of ¥560 million (−16.6%), or ¥63.24 per share. Against those targets the first quarter delivered 22.5% of revenue but only 10.6% of operating profit, 13.9% of ordinary profit and 8.0% of net profit; the filing does not discuss how profit is expected to be spread across the year.
The dividend forecast was also left unchanged: ¥5.00 at the half-year and ¥8.00 at the year-end, for ¥13.00 a share against ¥15.50 for FY3/2026, which paid ¥5.00 and ¥10.50. That is a 16.1% reduction and about 20.6% of guided earnings per share; the quarterly filing gives no reason for the lower payout.
| Metric | Q1 FY3/2027 | Q1 FY3/2026 | Change |
|---|---|---|---|
| Revenue (¥ million) | 5,293 | 5,347 | −1.0% |
| Gross profit (¥ million) | 2,245 | 2,242 | +0.1% |
| Gross margin | 42.4% | 41.9% | +0.5 pt |
| SG&A expenses (¥ million) | 2,154 | 2,161 | −0.3% |
| Operating profit (¥ million) | 90 | 80 | +12.6% |
| Operating margin | 1.7% | 1.5% | +0.2 pt |
| Ordinary profit (¥ million) | 121 | 94 | +29.4% |
| Pre-tax profit (¥ million) | 120 | 93 | +29.1% |
| Net profit attrib. to owners of parent (¥ million) | 45 | 45 | −0.2% |
| Comprehensive income (¥ million) | 205 | −151 | loss to profit |
| EPS (¥) | 5.14 | 5.13 | +0.2% |
| Interior Decoration — revenue (¥ million) | 5,164 | 5,211 | −0.9% |
| Interior Decoration — segment profit (¥ million) | 86 | 67 | +29.0% |
| Other (welfare products) — revenue (¥ million) | 128 | 135 | −5.2% |
| Other (welfare products) — segment profit (¥ million) | 3 | 13 | −71.5% |
| Total assets (¥ million) | 22,805 | 23,070 | −1.1% |
| Net assets (¥ million) | 15,960 | 15,850 | +0.7% |
| Equity ratio | 69.6% | 68.3% | +1.3 pt |
| FY3/2027 guidance — revenue (¥ million) | 23,500 | — | +1.1% |
| FY3/2027 guidance — operating profit (¥ million) | 850 | — | −11.0% |
| FY3/2027 guidance — ordinary profit (¥ million) | 870 | — | −11.5% |
| FY3/2027 guidance — net profit (¥ million) | 560 | — | −16.6% |
| FY3/2027 guidance — EPS (¥) | 63.24 | — | — |
| Annual dividend per share (¥) | 13.00 | 15.50 | −16.1% |
JapanStockPulse provides informational content only and does not constitute investment advice. Figures are taken from the company's published earnings short report and may be subject to subsequent revision.