Orders are running well ahead of shipments
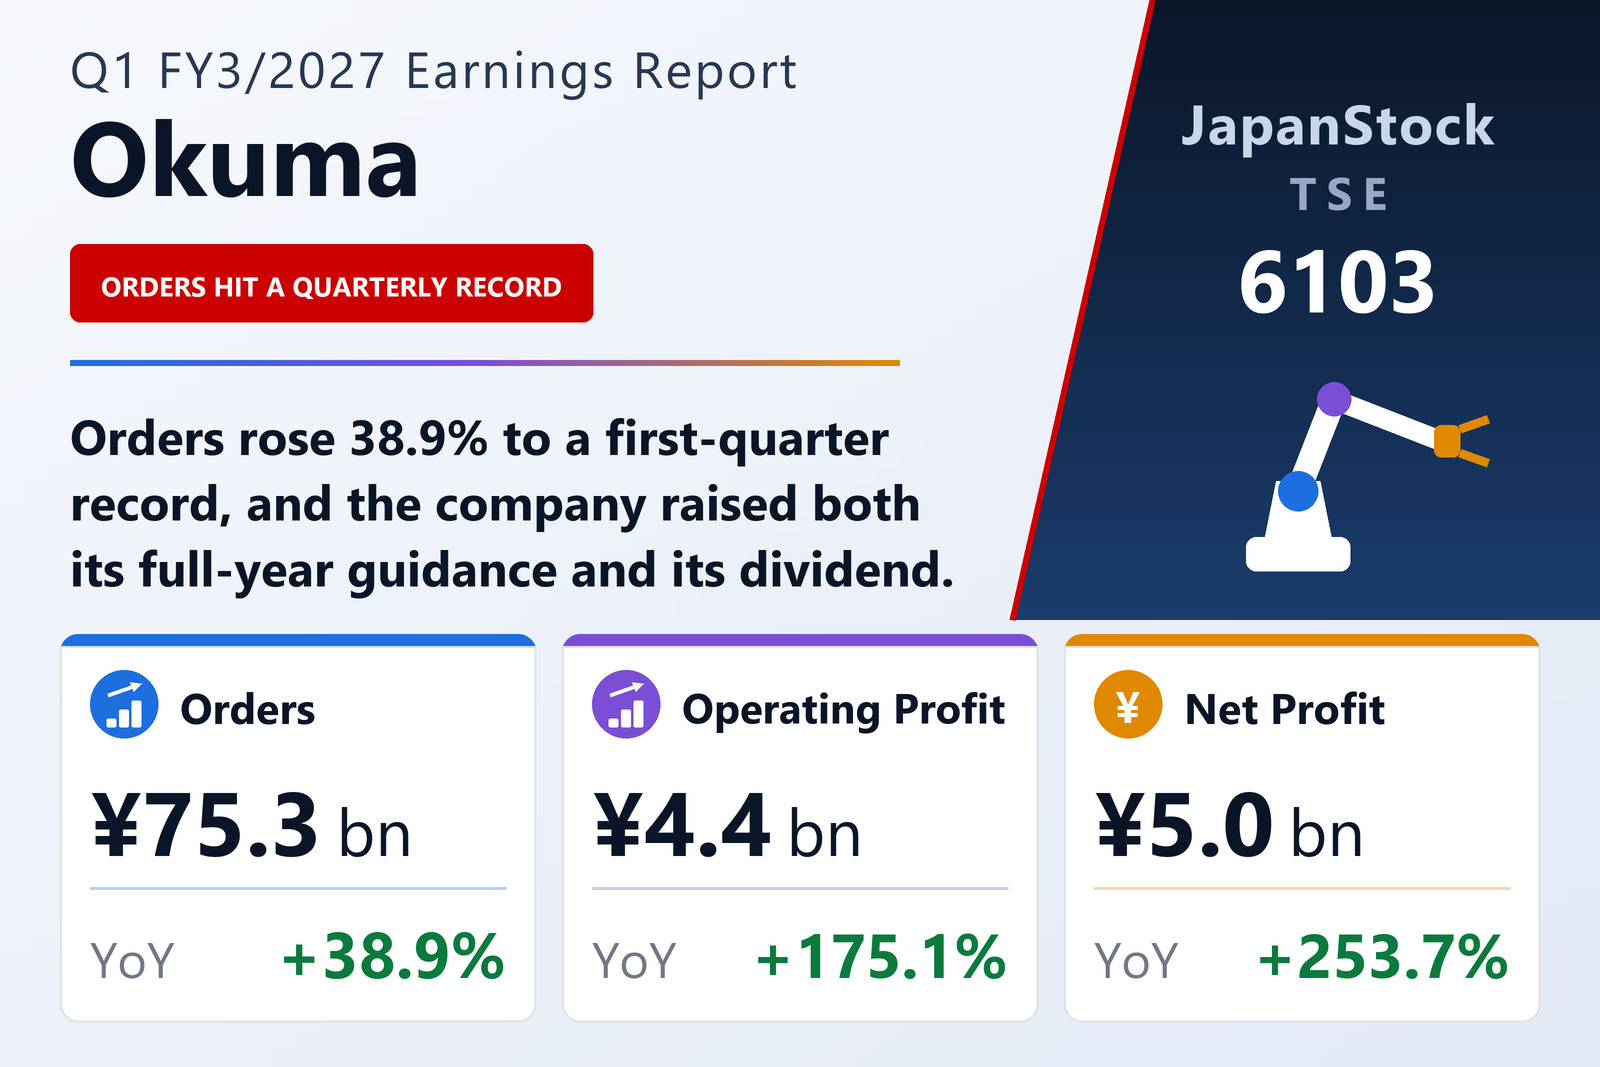
Okuma Corporation (TSE: 6103), the Aichi-based machine-tool builder, published consolidated results for the three months to June 30, 2026 on August 5, 2026 under Japanese GAAP. Net sales rose 16.3% to ¥51,903 million, operating profit 175.1% to ¥4,399 million, ordinary profit 129.0% to ¥4,930 million and net profit 253.7% to ¥4,984 million, for earnings per share of ¥84.52 against ¥23.29. The operating margin widened to 8.5% from 3.6%. Net profit came in slightly above ordinary profit, at ¥4,984 million against ¥4,930 million.
The number that matters most for a capital-goods maker is the order book, and here it is ¥75,263 million, up 38.9% and a record high for a first quarter — running roughly 45% ahead of the quarter's shipments. That gap is the visibility behind the upgraded guidance below.
Two regions carrying it, two in small losses
Japan, the largest region, grew external revenue 13.3% to ¥23,888 million and profit from ¥246 million to ¥2,754 million. Demand was broad-based, the company says, including semiconductor equipment and shipbuilding. The Americas grew revenue 36.4% to ¥18,063 million and profit 412.8% to ¥1,964 million, on high demand from aerospace, space satellites, defense and data centres.
Europe grew revenue 8.6% to ¥7,745 million but posted a segment loss of ¥172 million against a ¥29 million profit: German automotive was weak while defense and aerospace demand surged. Asia-Pacific fell 30.7% in revenue to ¥2,205 million and swung to a ¥36 million loss from a ¥173 million profit, as Chinese customers paused big-ticket EV-related investment even though semiconductor-equipment demand held steady.
Guidance and dividend both raised
Total assets rose 2.7% from the March year-end to ¥349,647 million and net assets 3.1% to ¥263,942 million, with the equity ratio unchanged at 72.0% — one of the stronger balance sheets in Japanese machinery.
Guidance was revised upward with these results. For the full year the company now expects net sales of ¥260,000 million (+10.2%), operating profit of ¥26,000 million (+67.7%), ordinary profit of ¥26,500 million (+61.8%) and net profit of ¥20,000 million (+59.3%), for earnings per share of ¥340.65. For the first half it expects net sales of ¥119,000 million (+13.1%), operating profit of ¥11,500 million (+89.8%), ordinary profit of ¥12,000 million (+93.1%) and net profit of ¥10,500 million (+130.6%), for earnings per share of ¥178.84. The annual dividend was also revised up, to ¥120.00 from ¥100.00 (+20.0%), split ¥60.00 interim and ¥60.00 final.
Strategically the company points to its Mid-term Management Plan 2028 and its "Green-Smart Machine" concept — machines positioned on energy efficiency and intelligence rather than on cutting speed alone. The quarter has delivered 16.9% of the raised full-year operating-profit target, which with the order book at a record leaves the shape of the year resting on conversion rather than on demand.
| Metric | Q1 FY3/2027 | Q1 FY3/2026 | Change |
|---|---|---|---|
| Net sales (¥ million) | 51,903 | 44,646 | +16.3% |
| Orders received (¥ million) | 75,263 | — | +38.9% |
| Operating profit (¥ million) | 4,399 | 1,599 | +175.1% |
| Operating margin | 8.5% | 3.6% | +4.9 pt |
| Ordinary profit (¥ million) | 4,930 | 2,152 | +129.0% |
| Net profit (¥ million) | 4,984 | 1,409 | +253.7% |
| EPS (¥) | 84.52 | 23.29 | +262.9% |
| Japan — revenue (¥ million) | 23,888 | 21,086 | +13.3% |
| Japan — segment profit (¥ million) | 2,754 | 246 | +1,019.5% |
| Americas — revenue (¥ million) | 18,063 | 13,243 | +36.4% |
| Americas — segment profit (¥ million) | 1,964 | 383 | +412.8% |
| Europe — revenue (¥ million) | 7,745 | 7,134 | +8.6% |
| Europe — segment profit (¥ million) | −172 | 29 | profit to loss |
| Asia-Pacific — revenue (¥ million) | 2,205 | 3,183 | −30.7% |
| Asia-Pacific — segment profit (¥ million) | −36 | 173 | profit to loss |
| Total assets (¥ million) | 349,647 | 340,386 | +2.7% |
| Net assets (¥ million) | 263,942 | 255,919 | +3.1% |
| Equity ratio | 72.0% | 72.0% | +0.0 pt |
| FY3/2027 guidance — revenue (¥ million) | 260,000 | — | +10.2% |
| FY3/2027 guidance — operating profit (¥ million) | 26,000 | — | +67.7% |
| FY3/2027 guidance — ordinary profit (¥ million) | 26,500 | — | +61.8% |
| FY3/2027 guidance — net profit (¥ million) | 20,000 | — | +59.3% |
| FY3/2027 guidance — EPS (¥) | 340.65 | — | n.m. |
| Annual dividend per share (¥) | 120.00 | 100.00 | +20.0% |
JapanStockPulse provides informational content only and does not constitute investment advice. Figures are taken from the company's published earnings short report and may be subject to subsequent revision.