Operating profit grew three times as fast as revenue
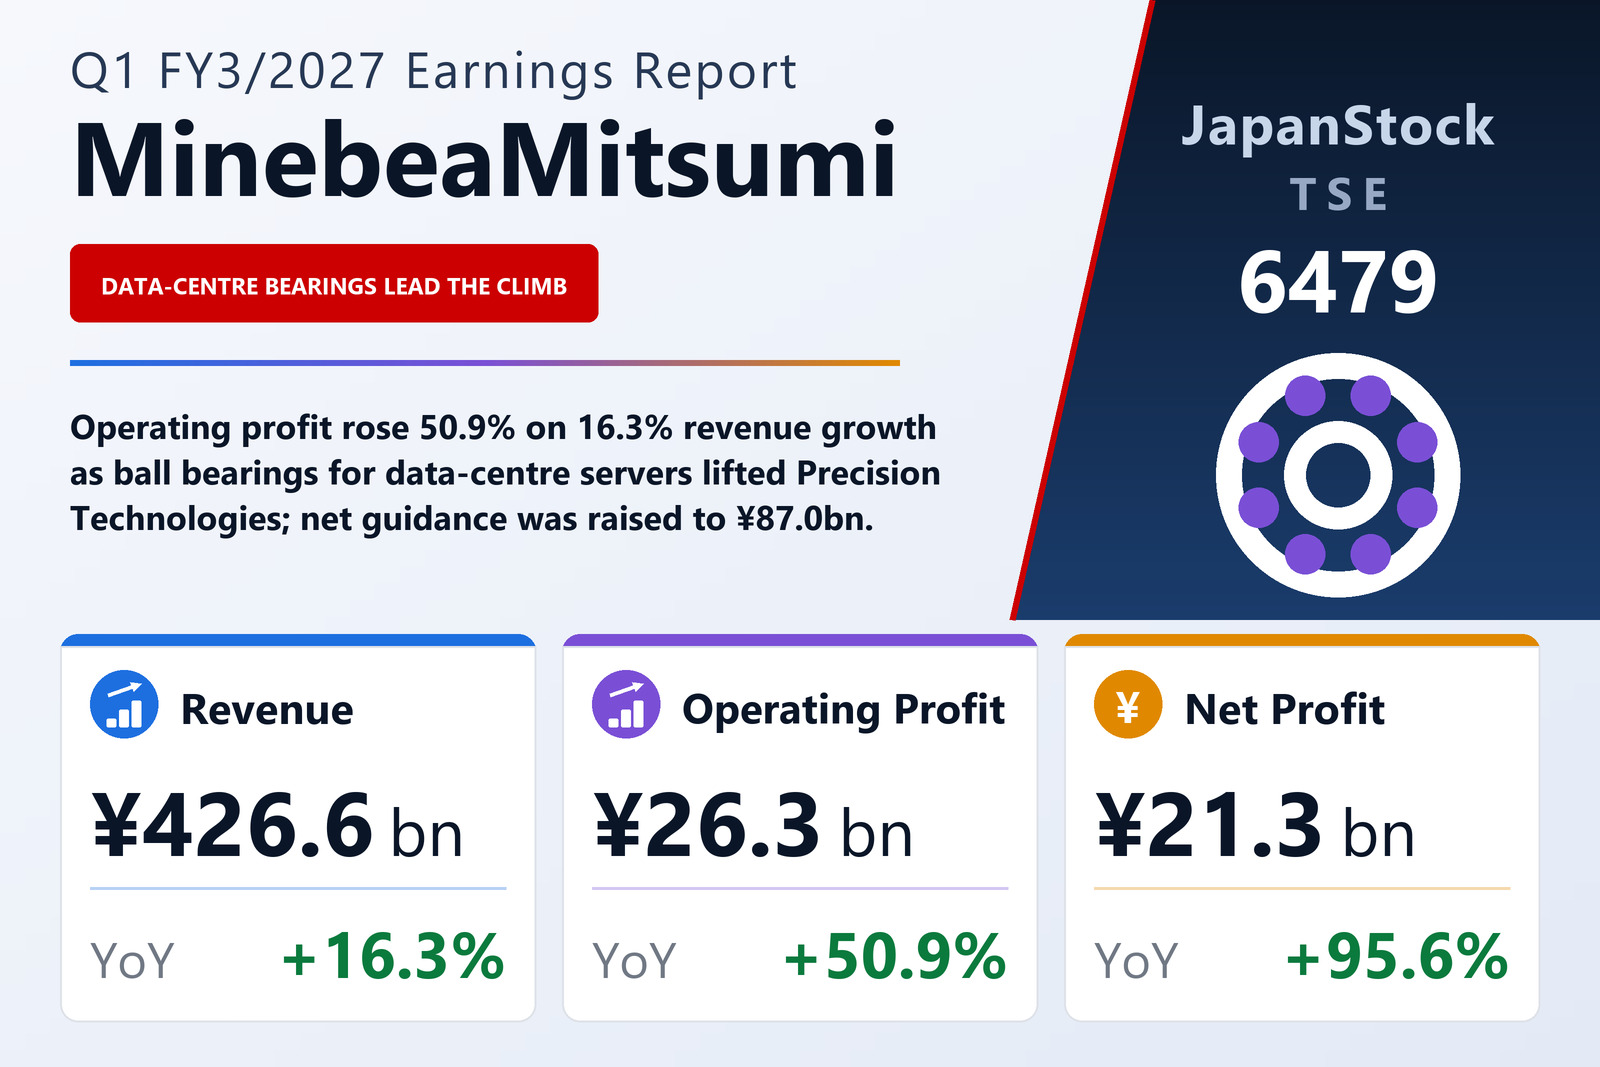
MinebeaMitsumi Inc. (TSE: 6479), the Japanese manufacturer whose mainstay product is the ball bearing and which also makes motors, semiconductors, optical devices and automotive keysets, door latches and door handles, published consolidated results for the first quarter of the fiscal year ending March 2027 — the three months from April 1 to June 30, 2026 — on August 5, 2026 under IFRS. Revenue rose 16.3% to ¥426,567 million, operating profit 50.9% to ¥26,313 million, profit before tax 91.2% to ¥29,812 million and profit attributable to owners of the parent 95.6% to ¥21,298 million, for basic earnings of ¥53.03 per share against ¥27.12. The filing names the Tokyo Stock Exchange as the listing venue.
Most of the gain came from the gross margin. Cost of sales rose 13.8% to ¥346,948 million, well short of revenue growth of 16.3%, so gross profit rose 28.2% to ¥79,619 million and the gross margin widened from 16.9% to 18.7%. Selling, general and administrative expenses grew 13.4% to ¥52,013 million, also slower than revenue, which trimmed their share of revenue from 12.5% to 12.2%. The two smaller lines beneath them worked the other way: other expenses jumped to ¥3,144 million from ¥237 million while other income rose only to ¥1,851 million from ¥1,423 million, a net swing of ¥2,479 million against operating profit that the filing does not itemise. Gross profit up ¥17,506 million, less ¥6,146 million of extra SG&A, less that ¥2,479 million, is exactly the ¥8,881 million by which operating profit grew, and the operating margin still rose from 4.8% to 6.2%.
Below the operating line, finance income did most of the work
Profit before tax grew much faster than operating profit — 91.2% against 50.9% — because net finance items swung sharply. Finance income rose to ¥6,737 million from ¥1,230 million while finance costs edged up to ¥3,238 million from ¥3,073 million, turning a net finance charge of ¥1,843 million into a net gain of ¥3,499 million. The cash-flow statement shows interest and dividend income of ¥6,644 million against ¥1,111 million a year earlier; the filing offers no narrative explanation for the jump. Income tax expense was ¥8,620 million, an effective rate of about 28.9% against 30.2%, leaving quarterly profit of ¥21,192 million, up 94.7%. Non-controlling interests absorbed a loss of ¥106 million against ¥4 million, which is why profit attributable to owners of the parent, at ¥21,298 million, sits slightly above the group total.
Comprehensive income was ¥37,974 million against ¥7,643 million, up 396.8%, and most of the gap between it and profit is currency. Other comprehensive income came to ¥16,782 million, of which ¥13,693 million was exchange differences on translating foreign operations — against a translation loss of ¥2,490 million a year earlier — and ¥3,184 million was gains on financial assets measured at fair value through other comprehensive income.
Bearings for servers and aircraft carried the quarter
The company describes a world economy on a moderate recovery path but uneven by region, with energy prices held high by tension in the Middle East, and says it worked on productivity, thorough cost reduction and the development and sale of high-value-added products. Against that background Precision Technologies — ball bearings, rod-end bearings used mainly in aircraft, pivot assemblies for hard-disk drives and aircraft fasteners — lifted revenue 23.7% to ¥82,048 million and segment profit 34.1% to ¥19,119 million, a margin of 23.3%. The filing says ball-bearing sales rose on firm demand for data-centre servers, and rod-end bearing sales on higher aircraft-related demand. The segment produced less than a fifth of group revenue but more than half of the ¥32,753 million earned by the four reporting segments combined. Segment revenue figures in this article are sales to external customers, which sum to group revenue.
Motor, Lighting & Sensing, whose products run from LCD backlights and hard-disk spindle motors to stepping, DC, fan and automotive motors and measuring instruments, grew revenue 20.1% to ¥124,521 million and segment profit 58.3% to ¥7,567 million, mainly on higher demand for spindle motors and fan motors. Semiconductors & Electronics, the largest segment by revenue at ¥134,217 million, up 14.5%, recorded the steepest profit growth, 168.3% to ¥5,995 million, mainly on higher sales of optical devices — although at 4.5% its margin is the thinnest of the three segments whose profit grew.
The exception was Access Solutions, which makes keysets, door latches and door handles for cars plus parts for industrial equipment. Revenue rose 7.0% to ¥84,459 million as production at its main automotive customers increased, but segment profit fell 97.3% to ¥72 million from ¥2,728 million, a drop of ¥2,656 million that the filing attributes to structural reform in Europe. The remaining businesses, software development and in-house machinery, lifted revenue to ¥1,322 million but widened their operating loss to ¥646 million from ¥451 million, and unallocated corporate costs fell to ¥5,794 million from ¥6,115 million. From this quarter an organisational change moved some businesses between Precision Technologies and Motor, Lighting & Sensing, and between Semiconductors & Electronics and Access Solutions; the prior-year segment figures have been restated on the new basis.
Inventories and cash rose; the equity ratio slipped 0.3 points
Total assets rose ¥68,243 million to ¥1,883,080 million from March 31, 2026, which the company attributes mainly to increases in cash and cash equivalents, inventories and property, plant and equipment. Inventories rose ¥41,598 million to ¥432,912 million, cash ¥14,260 million to ¥241,782 million and PP&E ¥15,611 million to ¥600,914 million, while trade and other receivables fell ¥26,535 million to ¥329,982 million. Liabilities rose ¥40,463 million to ¥944,269 million, mainly in trade and other payables, and bonds and borrowings totalled ¥489,424 million against ¥482,491 million. Equity attributable to owners of the parent rose 3.1% to ¥926,724 million, but because assets grew faster, the ratio of owners' equity to total assets eased from 49.5% to 49.2%.
Operating cash flow roughly doubled, to ¥47,462 million from ¥23,293 million, which the filing puts down mainly to pre-tax profit, depreciation and amortisation of ¥18,742 million, and movements in inventories and receivables: a ¥30,127 million inflow from lower receivables and ¥17,018 million from higher payables more than covered a ¥37,056 million build in inventories. Investing activities used ¥30,674 million against ¥19,009 million, chiefly ¥29,493 million of PP&E purchases against ¥18,019 million, leaving free cash flow of about ¥16,788 million. Financing used ¥5,863 million, mainly ¥10,040 million of dividends, against an inflow of ¥38,554 million a year earlier, when short-term borrowings rose ¥51,517 million.
Net-profit guidance raised by ¥4,000 million; revenue and operating targets held
In the same filing MinebeaMitsumi revised its forecasts in light of first-quarter results and recent conditions. It raised profit attributable to owners of the parent for the first half to ¥40,500 million from ¥36,500 million (+11.0%) and for the full year to ¥87,000 million from ¥83,000 million (+4.8%), lifting full-year basic EPS guidance to ¥216.64 from ¥206.68; the previous forecast was published on May 12, 2026. Revenue and operating profit were left at ¥1,690,000 million and ¥120,000 million for the year and ¥846,500 million and ¥53,000 million for the half, so the extra ¥4,000 million is expected below the operating line; the filing does not say where. Against FY3/2026 actuals, the full-year plan means revenue up 1.5%, operating profit up 15.4% and net profit down 12.2% from ¥99,034 million.
Set against those targets, the first quarter delivered 25.2% of full-year revenue, 21.9% of operating profit and 24.5% of net profit. The first-half forecast implies a second quarter of about ¥419,933 million of revenue, slightly below the ¥426,567 million just booked, with operating profit of ¥26,687 million, close to the first quarter's. For the second half the plan implies revenue of ¥843,500 million, 4.8% below the prior year's second half, operating profit of ¥67,000 million, up 12.4%, and net profit of ¥46,500 million, down 34.0% from ¥70,449 million — so the full-year fall in net profit comes from that high prior-year comparison rather than from any guided decline in operating profit. The filing does not explain the lower revenue it implies for the rest of the year.
The dividend forecast was not revised: ¥30.00 at the half-year and ¥30.00 at the year-end, an annual ¥60.00 against ¥50.00, up 20.0%. The company says it will set the annual dividend with a consolidated payout ratio of around 30% as a guide; ¥60.00 is about 27.7% of the guided ¥216.64 of earnings per share. According to the filing, the quarterly statements were not reviewed by an auditor, and amendments to IFRS 9 and IFRS 7 applied from this quarter had an immaterial effect.
| Metric | Q1 FY3/2027 | Q1 FY3/2026 | Change |
|---|---|---|---|
| Revenue (¥ million) | 426,567 | 366,925 | +16.3% |
| Gross profit (¥ million) | 79,619 | 62,113 | +28.2% |
| Gross margin | 18.7% | 16.9% | +1.7 pt |
| SG&A expenses (¥ million) | 52,013 | 45,867 | +13.4% |
| Operating profit (¥ million) | 26,313 | 17,432 | +50.9% |
| Operating margin | 6.2% | 4.8% | +1.4 pt |
| Finance income (¥ million) | 6,737 | 1,230 | +447.7% |
| Pre-tax profit (¥ million) | 29,812 | 15,589 | +91.2% |
| Net profit (¥ million) | 21,192 | 10,885 | +94.7% |
| Net profit attrib. to owners of parent (¥ million) | 21,298 | 10,889 | +95.6% |
| Comprehensive income (¥ million) | 37,974 | 7,643 | +396.8% |
| EPS (¥) | 53.03 | 27.12 | +95.5% |
| Precision Technologies — revenue (¥ million) | 82,048 | 66,304 | +23.7% |
| Precision Technologies — segment profit (¥ million) | 19,119 | 14,258 | +34.1% |
| Motor, Lighting & Sensing — revenue (¥ million) | 124,521 | 103,644 | +20.1% |
| Motor, Lighting & Sensing — segment profit (¥ million) | 7,567 | 4,778 | +58.3% |
| Semiconductors & Electronics — revenue (¥ million) | 134,217 | 117,210 | +14.5% |
| Semiconductors & Electronics — segment profit (¥ million) | 5,995 | 2,234 | +168.3% |
| Access Solutions — revenue (¥ million) | 84,459 | 78,899 | +7.0% |
| Access Solutions — segment profit (¥ million) | 72 | 2,728 | −97.3% |
| Other — revenue (¥ million) | 1,322 | 868 | +52.1% |
| Other — segment profit (¥ million) | −646 | −451 | loss widened |
| Total assets (¥ million) | 1,883,080 | 1,814,837 | +3.8% |
| Net assets (¥ million) | 938,811 | 911,031 | +3.0% |
| Equity attrib. to owners of parent (¥ million) | 926,724 | 898,971 | +3.1% |
| Equity ratio | 49.2% | 49.5% | −0.3 pt |
| Operating cash flow (¥ million) | 47,462 | 23,293 | +103.8% |
| FY3/2027 guidance — revenue (¥ million) | 1,690,000 | — | +1.5% |
| FY3/2027 guidance — operating profit (¥ million) | 120,000 | — | +15.4% |
| FY3/2027 guidance — net profit attrib. to owners of parent (¥ million) | 87,000 | — | −12.2% |
| FY3/2027 guidance — EPS (¥) | 216.64 | — | −12.1% |
| Annual dividend per share (¥) | 60.00 | 50.00 | +20.0% |
JapanStockPulse provides informational content only and does not constitute investment advice. Figures are taken from the company's published earnings short report and may be subject to subsequent revision.