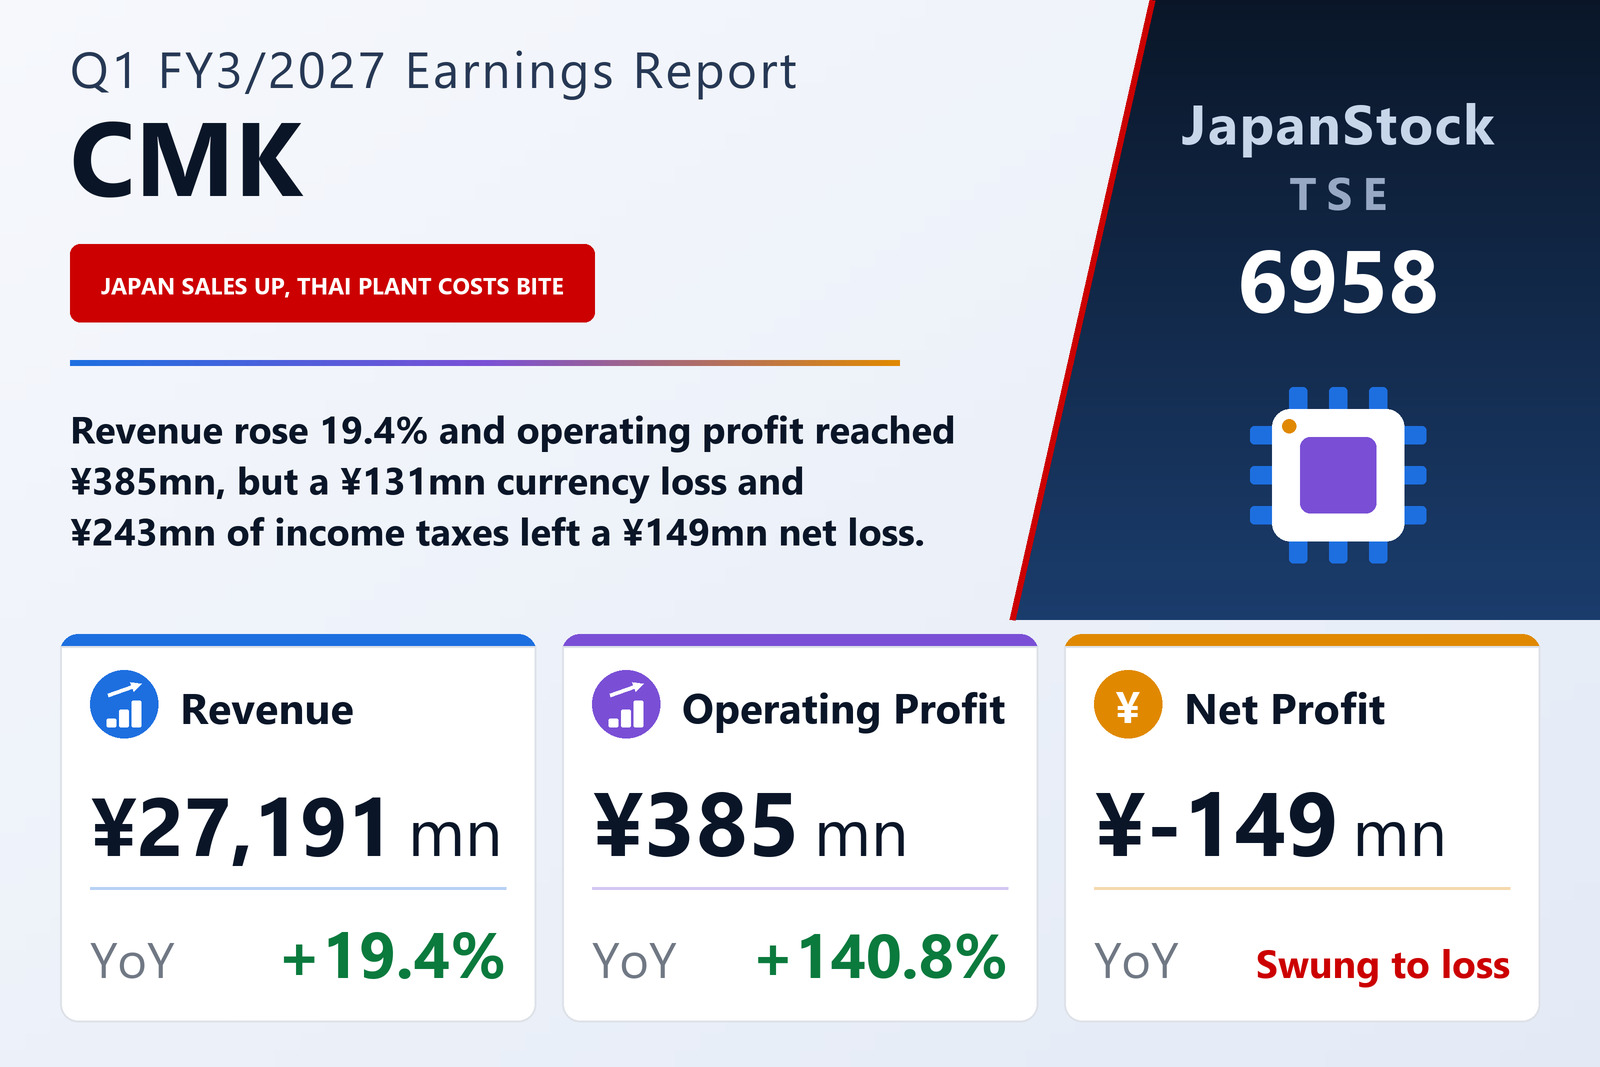
Sales up a fifth, operating profit more than doubled — and a net loss anyway
CMK CORPORATION (TSE: 6958), a group whose mainstay is the automotive field, published consolidated results for the first quarter of the fiscal year ending March 2027 — the three months from April 1 to June 30, 2026 — on August 5, 2026 under Japanese GAAP. Revenue rose 19.4% to ¥27,191 million and operating profit 140.8% to ¥385 million, while ordinary profit fell 43.0% to ¥127 million and the result attributable to owners of the parent swung to a loss of ¥149 million from a profit of ¥80 million. Earnings per share were −¥2.10 against ¥1.12. The filing names the Tokyo Stock Exchange as its listing exchange.
The filing credits Japanese customers with the sales growth. Sales to a major European customer fell, but sales to major Japanese customers progressed smoothly, and the company says orders from its main customers in the automotive field — its core business — are for now running firmly, even as it notes some swing back from electric vehicles towards plug-in hybrids amid uncertain EV demand.
Cost of sales outran revenue; overheads did not
The margin arithmetic is less flattering than the operating-profit growth rate. Cost of sales rose 20.3% to ¥23,741 million, slightly faster than revenue, so gross profit grew only 13.3% to ¥3,449 million and the gross margin narrowed from 13.4% to 12.7%. What lifted operating profit was overheads: selling, general and administrative expenses rose just 6.2% to ¥3,063 million, so the operating margin still edged up from 0.7% to 1.4%. On a base of ¥160 million, an extra ¥225 million is enough for a 140.8% increase.
The filing names the forces pulling in each direction. Higher utilisation at the production plants as output expanded helped. Against that, the company booked adjustment costs in a capacity-optimisation process at its Thai plant — costs that arose at the start of the period and have since been resolved — and higher equipment depreciation after a new Thai plant started operating. Depreciation for the quarter rose 51.0% to ¥2,233 million from ¥1,479 million.
Currency and taxes turned a profit into a loss
Almost everything below the operating line moved the wrong way. Non-operating income fell to ¥191 million from ¥276 million, chiefly because last year's ¥112 million foreign-exchange gain did not recur, while non-operating expenses more than doubled to ¥449 million from ¥212 million. The largest item was a ¥131 million foreign-exchange loss: the filing says the yen turned upward against the Thai baht while continuing to weaken against the euro and the U.S. dollar, so the exchange effect on the group's foreign-currency receivables and payables flipped from a gain to a loss. Taxes and dues rose to ¥111 million from ¥15 million, and interest expense to ¥169 million from ¥157 million.
Ordinary profit therefore fell 43.0% to ¥127 million. Extraordinary items were small — chiefly a ¥4 million loss on retirement of fixed assets — leaving pre-tax profit of ¥123 million, down from ¥202 million. Income taxes, however, rose 146.8% to ¥243 million, nearly twice pre-tax profit; the filing notes that quarterly tax expense is calculated by applying a reasonably estimated effective tax rate for the full fiscal year to pre-tax profit. The result was a net loss of ¥120 million and, after ¥29 million of profit attributable to non-controlling interests, a loss of ¥149 million attributable to owners of the parent. Comprehensive income was nonetheless positive at ¥614 million, against a comprehensive loss of ¥3,555 million a year earlier, as a ¥518 million valuation gain on securities and a ¥274 million translation adjustment replaced last year's ¥3,716 million translation loss.
Japan carried the quarter; Southeast Asia's loss more than tripled
Segment sales below are sales to external customers. Japan was the engine: sales rose 29.1% to ¥17,756 million as automotive sales grew with higher domestic vehicle sales, and segment profit rose 602.7% to ¥1,111 million from ¥158 million, which the filing attributes to higher output of ADAS-related products and a product-mix shift towards higher value-added products. China sales fell 7.8% to ¥3,694 million as EV demand declined and a major customer's sales to Europe fell, yet segment profit rose 7.4% to ¥424 million on last year's rationalisation of production equipment and other productivity gains.
Southeast Asia grew sales 16.6% to ¥4,712 million on higher sales to major Japanese customers as vehicle sales in the region increased, but its segment loss widened to ¥1,247 million from ¥399 million on the Thai plant adjustment costs and new-plant depreciation — a loss larger than Japan's entire segment profit. Europe & U.S. sales rose 5.0% to ¥1,027 million on higher sales to major Japanese customers, while segment profit fell 36.2% to ¥40 million; the filing gives no reason for that decline. Segment results sum to ¥329 million, and an adjustment of ¥56 million — intersegment eliminations of ¥496 million less corporate expenses of ¥440 million — brings the total to the reported operating profit of ¥385 million.
A slightly smaller balance sheet, with borrowing shifted to the short term
Total assets fell 0.7% to ¥150,398 million from ¥151,522 million at March 31, 2026. Cash and deposits declined ¥871 million to ¥18,677 million, which the filing attributes mainly to capital expenditure at the Thai production plants, loan repayments and dividend payments, while inventories rose: merchandise and finished goods, work in process and raw materials together reached ¥20,121 million against ¥18,446 million. Property, plant and equipment fell ¥1,532 million to ¥78,734 million, which the filing attributes to exchange effects, including a baht that weakened only modestly against the yen; within it, construction in progress fell to ¥10,003 million from ¥12,304 million while machinery and vehicles rose to ¥29,980 million from ¥28,530 million.
On the liabilities side, short-term borrowings rose ¥1,300 million to ¥11,550 million, which the company says was to increase liquidity, while long-term borrowings fell ¥2,224 million to ¥20,031 million on baht depreciation and repayments. Short- and long-term borrowings, including the current portion of long-term loans, plus ¥3,000 million of bonds, came to ¥41,133 million against ¥42,085 million. Net assets fell 0.9% to ¥85,237 million, chiefly because retained earnings fell ¥1,575 million on dividend payments, and the equity ratio slipped from 55.1% to 54.9%.
Full-year guidance revised; the ¥28 dividend forecast stands
CMK revised the full-year FY3/2027 forecast it published on May 14, 2026, in a separate notice dated August 5, 2026. The tanshin gives only the new figures, not the previous ones, and does not explain the revision. It now expects revenue of ¥110,000 million (+9.8%), operating profit of ¥5,000 million (+79.3%), ordinary profit of ¥4,700 million (+13.6%) and profit attributable to owners of the parent of ¥3,000 million (−25.5%), or ¥42.08 per share. The first quarter delivered 24.7% of guided revenue but only 7.7% of guided operating profit, leaving ¥4,615 million of operating profit and ¥3,149 million of net profit to be earned in the remaining nine months.
The dividend forecast of ¥28.00 per share, all payable at the year-end, was not changed, against ¥20.00 for FY3/2026, an increase of 40.0%. Under a policy announced on May 19, 2026, the company links dividends to shareholders' equity, targeting a consolidated dividend-on-equity ratio (DOE) of 3%. Set against the guided ¥42.08 of earnings per share, ¥28.00 would be a payout of about 66.5%.
| Metric | Q1 FY3/2027 | Q1 FY3/2026 | Change |
|---|---|---|---|
| Revenue (¥ million) | 27,191 | 22,779 | +19.4% |
| Gross profit (¥ million) | 3,449 | 3,043 | +13.3% |
| Gross margin | 12.7% | 13.4% | −0.7 pt |
| SG&A expenses (¥ million) | 3,063 | 2,883 | +6.2% |
| Operating profit (¥ million) | 385 | 160 | +140.8% |
| Operating margin | 1.4% | 0.7% | +0.7 pt |
| Foreign exchange gain (loss) (¥ million) | −131 | 112 | profit to loss |
| Ordinary profit (¥ million) | 127 | 223 | −43.0% |
| Pre-tax profit (¥ million) | 123 | 202 | −39.1% |
| Income taxes (¥ million) | 243 | 98 | +146.8% |
| Net profit attrib. to owners of parent (¥ million) | −149 | 80 | profit to loss |
| Comprehensive income (¥ million) | 614 | −3,555 | loss to profit |
| EPS (¥) | −2.10 | 1.12 | profit to loss |
| Depreciation (¥ million) | 2,233 | 1,479 | +51.0% |
| Japan — revenue (¥ million) | 17,756 | 13,753 | +29.1% |
| Japan — segment profit (¥ million) | 1,111 | 158 | +602.7% |
| China — revenue (¥ million) | 3,694 | 4,005 | −7.8% |
| China — segment profit (¥ million) | 424 | 395 | +7.4% |
| Southeast Asia — revenue (¥ million) | 4,712 | 4,042 | +16.6% |
| Southeast Asia — segment profit (¥ million) | −1,247 | −399 | loss widened |
| Europe & U.S. — revenue (¥ million) | 1,027 | 977 | +5.0% |
| Europe & U.S. — segment profit (¥ million) | 40 | 63 | −36.2% |
| Total assets (¥ million) | 150,398 | 151,522 | −0.7% |
| Net assets (¥ million) | 85,237 | 86,049 | −0.9% |
| Equity ratio | 54.9% | 55.1% | −0.2 pt |
| Cash and deposits (¥ million) | 18,677 | 19,548 | −4.5% |
| Short-term borrowings (¥ million) | 11,550 | 10,250 | +12.7% |
| Long-term borrowings (¥ million) | 20,031 | 22,255 | −10.0% |
| FY3/2027 guidance — revenue (¥ million) | 110,000 | — | +9.8% |
| FY3/2027 guidance — operating profit (¥ million) | 5,000 | — | +79.3% |
| FY3/2027 guidance — ordinary profit (¥ million) | 4,700 | — | +13.6% |
| FY3/2027 guidance — net profit (¥ million) | 3,000 | — | −25.5% |
| FY3/2027 guidance — EPS (¥) | 42.08 | — | — |
| Annual dividend per share (¥) | 28.00 | 20.00 | +40.0% |
JapanStockPulse provides informational content only and does not constitute investment advice. Figures are taken from the company's published earnings short report and may be subject to subsequent revision.