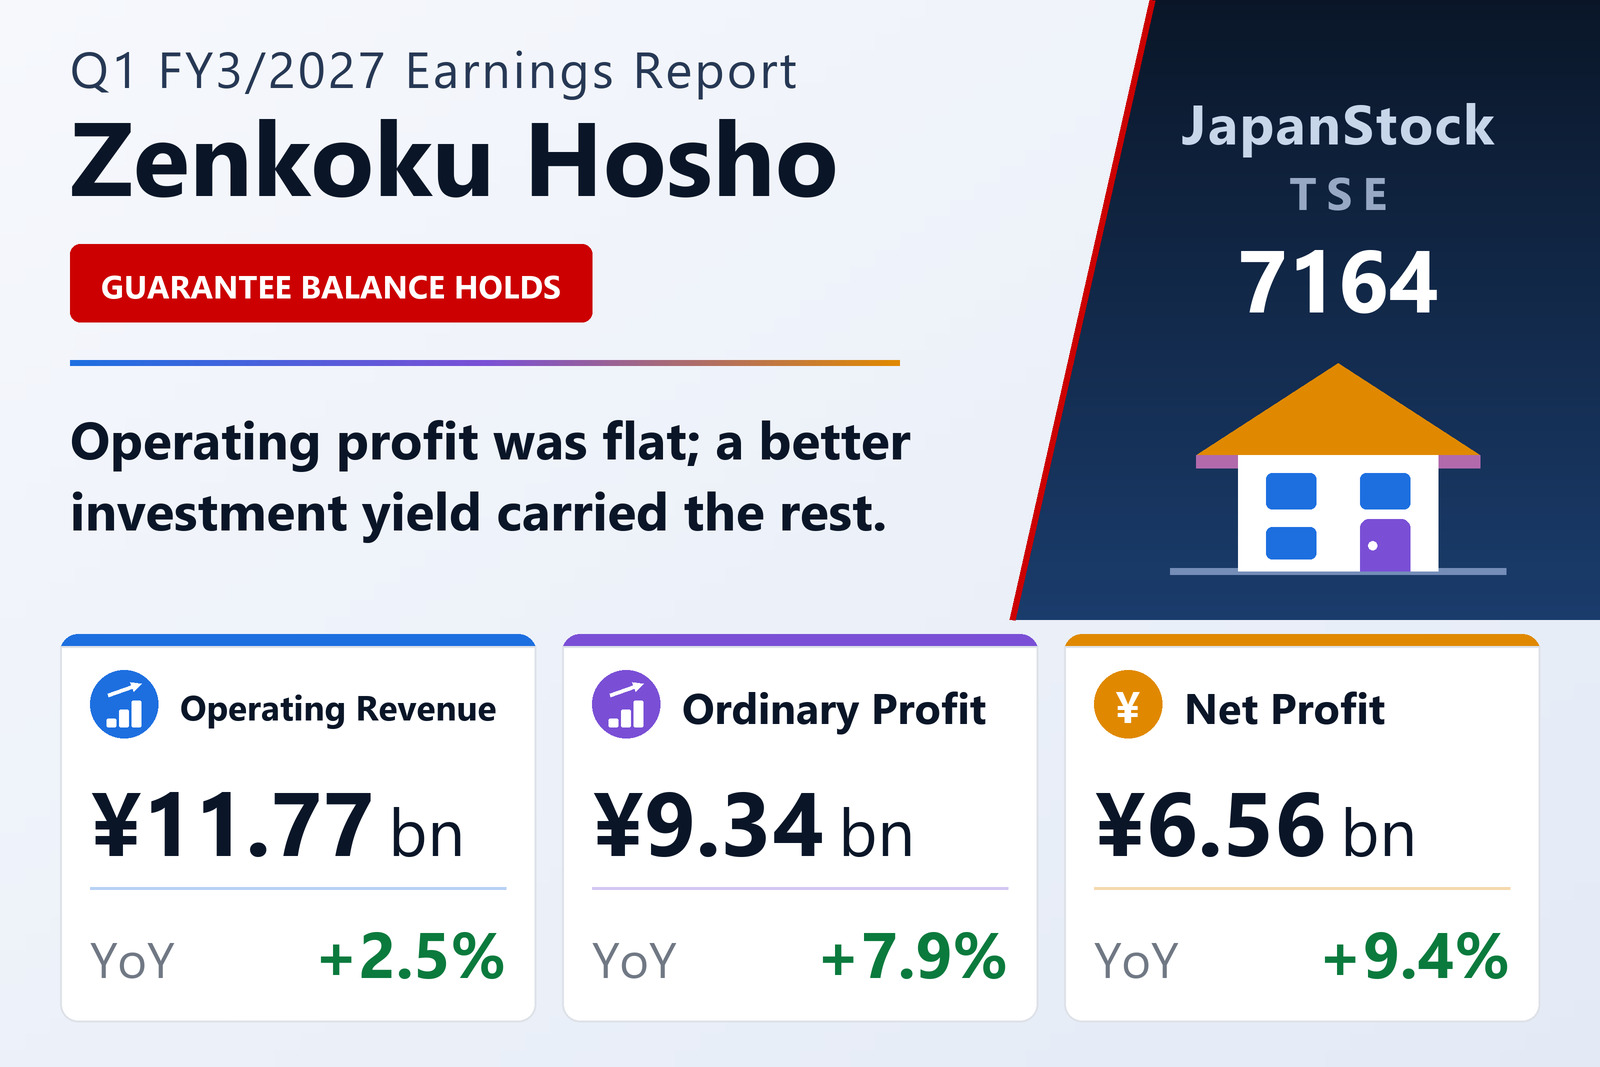
The growth came from below the operating line
Zenkoku Hosho Co., Ltd. (TSE: 7164), Japan's largest independent housing-loan credit guarantee company, published consolidated results for the three months to June 30, 2026 on August 5, 2026 under Japanese GAAP. Operating revenue rose 2.5% to ¥11,772 million on a steady balance of guarantee obligations. Operating profit, however, was flat at ¥7,724 million (+0.1%), held back by higher operating expenses — a slowdown from the 5.0% growth recorded a year earlier.
Ordinary profit rose 7.9% to ¥9,335 million on an improved yield on the group's investment portfolio and on the recognition of equity-method investment income, and net profit attributable to owners of the parent rose 9.4% to ¥6,562 million. Earnings per share rose faster still, 10.9% to ¥49.39, because the average share count fell from 134.7 million to 132.9 million over the year. Comprehensive income rose 24.0% to ¥7,808 million.
One presentation change affects the comparison. From this quarter, gains and losses on sales of investment securities held for pure investment purposes are reported net within non-operating income and expenses rather than as extraordinary items, because such transactions now occur routinely. The year-on-year change in ordinary profit is calculated against restated prior-year figures on the same basis.
A single-segment business
Zenkoku Hosho reports credit guarantee as its single reportable segment; other activities are not quantitatively material and segment information is therefore omitted. The operating margin, at 65.6% against 67.2% a year earlier, gives a sense of the economics: this is a fee business with a very small cost base, where the swing factors are the guarantee balance, credit costs and the return on the reserves held against future claims.
Balance sheet
Total assets fell 1.4% from the March year-end to ¥493,710 million. Current assets fell 6.0% to ¥123,024 million on lower securities and cash, while non-current assets edged up 0.2% to ¥370,686 million as an increase in investment securities more than offset declines in long-term deposits and long-term loans.
Total liabilities fell 1.9% to ¥250,739 million: current liabilities dropped 12.8% to ¥35,799 million, chiefly on lower income taxes payable, while non-current liabilities edged up 0.1% to ¥214,940 million as long-term deferred revenue — the unearned portion of guarantee fees already collected — increased. Net assets fell 0.9% to ¥242,970 million on lower retained earnings, so the equity ratio still improved slightly to 49.2% from 48.9% as the asset side shrank faster.
Guidance unchanged
Guidance for FY3/2027 is unchanged: operating revenue of ¥60,600 million (+3.2%), operating profit of ¥42,000 million (+1.5%), ordinary profit of ¥47,200 million (+1.3%) and net profit of ¥32,700 million (+0.5%), for earnings per share of ¥246.12. First-quarter operating profit represents 18.4% of the full-year target.
The annual dividend forecast is ¥123.00 per share against ¥120.00 paid in FY3/2026 — split ¥50.00 interim and ¥73.00 year-end, against ¥45.00 and ¥75.00 last year. The forecast is unchanged from the figure previously announced.
| Metric | Q1 FY3/2027 | Q1 FY3/2026 | Change |
|---|---|---|---|
| Operating revenue (¥ million) | 11,772 | 11,481 | +2.5% |
| Operating profit (¥ million) | 7,724 | 7,712 | +0.1% |
| Operating margin | 65.6% | 67.2% | −1.6 pt |
| Ordinary profit (¥ million) | 9,335 | 8,652 | +7.9% |
| Net profit attrib. to owners of parent (¥ million) | 6,562 | 5,999 | +9.4% |
| Comprehensive income (¥ million) | 7,808 | 6,296 | +24.0% |
| EPS (¥) | 49.39 | 44.53 | +10.9% |
| Total assets (¥ million) | 493,710 | 500,831 | −1.4% |
| Net assets (¥ million) | 242,970 | 245,148 | −0.9% |
| Equity ratio | 49.2% | 48.9% | +0.3 pt |
| FY3/2027 guidance — operating revenue (¥ million) | 60,600 | — | +3.2% |
| FY3/2027 guidance — operating profit (¥ million) | 42,000 | — | +1.5% |
| FY3/2027 guidance — ordinary profit (¥ million) | 47,200 | — | +1.3% |
| FY3/2027 guidance — net profit (¥ million) | 32,700 | — | +0.5% |
| FY3/2027 guidance — EPS (¥) | 246.12 | — | n.m. |
| Annual dividend per share (¥) | 123.00 | 120.00 | +2.5% |
JapanStockPulse provides informational content only and does not constitute investment advice. Figures are taken from the company's published earnings short report and may be subject to subsequent revision.