Higher loan interest lifts ordinary income 15.9%
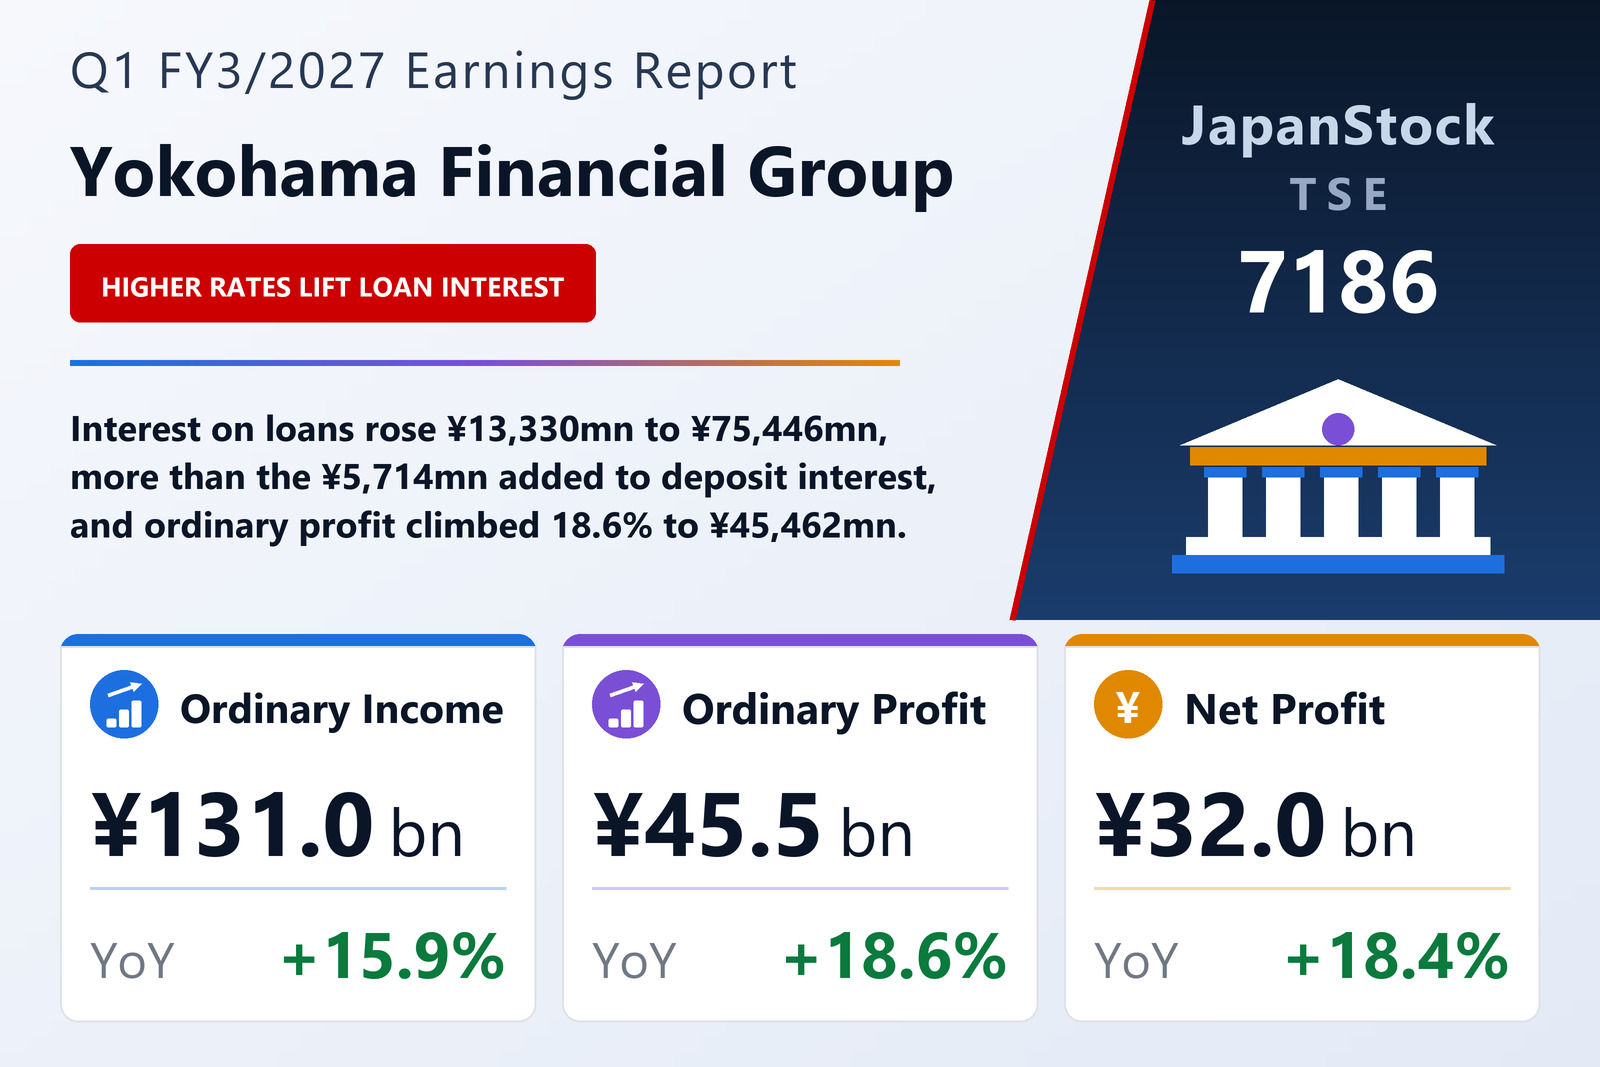
Yokohama Financial Group, Inc. (TSE: 7186), the holding company of Bank of Yokohama, Higashi-Nippon Bank and Kanagawa Bank, published consolidated first-quarter results for FY3/2027 on August 5, 2026, covering April 1 to June 30, 2026 under Japanese GAAP. Ordinary income rose 15.9% to ¥130,998 million, ordinary profit 18.6% to ¥45,462 million and net profit attributable to owners of the parent 18.4% to ¥32,028 million, which the group describes as its fourth consecutive year of first-quarter profit growth. Earnings per share rose 21.7% to ¥28.81 from ¥23.68, faster than net profit, because the average number of shares outstanding fell to 1,111,562,727 from 1,141,449,109.
The group attributes the rise in ordinary income to higher interest income as the interest-rate environment improved, led by interest on loans. Interest income grew 22.9% to ¥97,662 million, within which interest on loans rose 21.5% to ¥75,446 million and interest and dividends on securities 23.1% to ¥9,622 million. Other business income increased 12.4% to ¥9,207 million and other ordinary income 14.7% to ¥5,302 million, but fees and commissions income fell 9.3% to ¥18,660 million from ¥20,566 million. The filing gives no reason for the decline in fee income.
Deposit interest and bond-sale losses push up expenses
Ordinary expenses rose 14.6% to ¥85,536 million. The group names two causes: higher funding costs, chiefly interest on deposits, and losses booked on sales of yen-denominated bonds and cancellations of investment trusts carried out to improve the securities portfolio, which lifted other business expenses. Funding costs rose 30.5% to ¥28,563 million, with interest on deposits up 43.4% to ¥18,871 million from ¥13,157 million, and other business expenses rose 29.4% to ¥13,495 million. General and administrative expenses grew only 3.2% to ¥37,219 million. In yen terms, interest on loans added ¥13,330 million while interest on deposits added ¥5,714 million; ordinary income rose by ¥18,059 million against ¥10,928 million for ordinary expenses, leaving ordinary profit ¥7,131 million higher.
Below the ordinary line little changed. Extraordinary losses, all of them losses on disposal of fixed assets, were ¥191 million against ¥220 million, so profit before income taxes rose 18.8% to ¥45,272 million. Income taxes rose 19.6% to ¥12,899 million, equal to 28.5% of pre-tax profit against 28.3% a year earlier, and profit attributable to non-controlling interests was ¥344 million against ¥285 million. Comprehensive income climbed 56.2% to ¥75,462 million, because other comprehensive income more than doubled to ¥43,089 million from ¥20,989 million as the valuation difference on available-for-sale securities added ¥44,110 million against ¥21,641 million.
Core net business profit up 27.2% across the three banks
The supplementary material, which combines the three banks' non-consolidated figures, shows where the improvement came from. Gross business profit rose 12.9% to ¥78,366 million as domestic net interest income grew by ¥13,083 million to ¥69,473 million, which the group attributes to higher interest on loans and deposits and on securities as rates improved. That gain absorbed a ¥2,036 million fall in net fees and commissions, to ¥11,579 million, and a deeper loss on other business, which widened to ¥6,360 million from ¥3,513 million and included net losses on government and other bonds of ¥6,781 million against ¥3,097 million. Expenses rose 4.0% to ¥33,824 million, mainly on personnel costs, which the group links to base-pay increases and the introduction of performance-linked bonuses; the overhead ratio improved to 43.1% from 46.8%. Core net business profit excluding gains and losses on cancellation of investment trusts rose 27.2% to ¥51,329 million.
Credit-related costs of the three banks were ¥2,227 million against a net reversal of ¥406 million a year earlier, while net gains on equities and related instruments rose by ¥3,068 million to ¥4,023 million. Combined ordinary profit rose 22.4% to ¥47,496 million and combined net profit 23.4% to ¥36,010 million. At Bank of Yokohama alone, core net business profit excluding investment-trust cancellations rose 27.9% to ¥48,775 million. On a consolidated basis the group puts its annualised return on equity (TSE basis) at 8.9%, up 0.6 points, and its non-performing loan ratio under the Financial Reconstruction Act was unchanged at 1.3% at June 30, 2026, with disclosed claims of ¥240,524 million.
Deposits fall as public-sector funds leave; loans edge up
Total assets fell 2.3% to ¥25,082,919 million from March 31, 2026, with cash and due from banks down to ¥3,584,362 million from ¥4,152,428 million. Deposits declined by ¥612,982 million, or 2.9%, to ¥20,264,272 million, and negotiable certificates of deposit fell 17.1% to ¥227,676 million. The filing gives no reason, but the three-bank breakdown of domestic deposits shows public-sector deposits down ¥718.2 billion from March 31, 2026 to ¥782.8 billion, while individual deposits rose ¥66.1 billion and corporate deposits ¥48.2 billion. Loans edged up 0.1%, or ¥19,938 million, to ¥17,687,342 million, and securities fell 1.4% to ¥3,034,189 million.
Net assets rose 3.6% to ¥1,469,601 million, helped by the valuation difference on available-for-sale securities, which rose to ¥167,339 million from ¥123,229 million, and the equity ratio rose to 5.8% from 5.4%. The group notes that this ratio is not the capital adequacy ratio defined under Japan's capital adequacy notification, and says it will publish its June 30, 2026 capital adequacy ratio (international standard) once it has been calculated. Consolidated net unrealized gains on securities stood at ¥181,467 million against ¥117,954 million at March 31, 2026, as ¥213,172 million of net gains on equities outweighed ¥99,839 million of net losses on bonds.
Guidance and ¥47 dividend forecast unchanged
The full-year forecast was left unchanged: ordinary profit of ¥191,500 million (+23.5%) and net profit attributable to owners of the parent of ¥129,000 million (+21.1%), for earnings per share of ¥116.06. The filing gives no ordinary-income forecast. First-quarter net profit equals 24.8% of the full-year target, by the group's own calculation, and ordinary profit 23.7%. The EPS forecast does not reflect a share buyback that the group decided on and announced in a separate release the same day.
The dividend forecast is also unchanged, at ¥23 interim and ¥24 year-end, or ¥47 for the year, against ¥38 for FY3/2026 (¥17 interim and ¥21 year-end), an increase of 23.7%. As a subsequent event, the group signed a definitive agreement on July 30, 2026 with Sumitomo Mitsui Trust Bank and Fuyo General Lease to acquire part of the shares of Sumitomo Mitsui Trust Panasonic Finance. The acquisition is scheduled for October 1, 2026, after which that company is expected to become an equity-method affiliate; the group says the impact on its consolidated results is still being examined.
| Metric | Q1 FY3/2027 | Q1 FY3/2026 | Change |
|---|---|---|---|
| Ordinary income (¥ million) | 130,998 | 112,939 | +15.9% |
| — interest income (¥ million) | 97,662 | 79,445 | +22.9% |
| —— interest on loans (¥ million) | 75,446 | 62,116 | +21.5% |
| —— interest and dividends on securities (¥ million) | 9,622 | 7,815 | +23.1% |
| — fees and commissions income (¥ million) | 18,660 | 20,566 | −9.3% |
| — other business income (¥ million) | 9,207 | 8,188 | +12.4% |
| Ordinary expenses (¥ million) | 85,536 | 74,608 | +14.6% |
| — funding costs (¥ million) | 28,563 | 21,886 | +30.5% |
| —— interest on deposits (¥ million) | 18,871 | 13,157 | +43.4% |
| — other business expenses (¥ million) | 13,495 | 10,432 | +29.4% |
| — general and administrative expenses (¥ million) | 37,219 | 36,048 | +3.2% |
| Ordinary profit (¥ million) | 45,462 | 38,331 | +18.6% |
| Pre-tax profit (¥ million) | 45,272 | 38,110 | +18.8% |
| Net profit attrib. to owners of parent (¥ million) | 32,028 | 27,036 | +18.4% |
| Comprehensive income (¥ million) | 75,462 | 48,311 | +56.2% |
| EPS (¥) | 28.81 | 23.68 | +21.7% |
| Core net business profit excl. investment-trust cancellations, three banks combined (¥ million) | 51,329 | 40,332 | +27.2% |
| Total assets (¥ million) | 25,082,919 | 25,670,496 | −2.3% |
| Deposits (¥ million) | 20,264,272 | 20,877,254 | −2.9% |
| Negotiable certificates of deposit (¥ million) | 227,676 | 274,750 | −17.1% |
| Loans and bills discounted (¥ million) | 17,687,342 | 17,667,404 | +0.1% |
| Securities (¥ million) | 3,034,189 | 3,077,662 | −1.4% |
| Net assets (¥ million) | 1,469,601 | 1,418,344 | +3.6% |
| Equity ratio | 5.8% | 5.4% | +0.4 pt |
| FY3/2027 guidance — ordinary profit (¥ million) | 191,500 | — | +23.5% |
| FY3/2027 guidance — net profit (¥ million) | 129,000 | — | +21.1% |
| FY3/2027 guidance — EPS (¥) | 116.06 | — | — |
| Annual dividend per share (¥) | 47.00 | 38.00 | +23.7% |
JapanStockPulse provides informational content only and does not constitute investment advice. Figures are taken from the company's published earnings short report and may be subject to subsequent revision.