A mix shift, not a demand problem
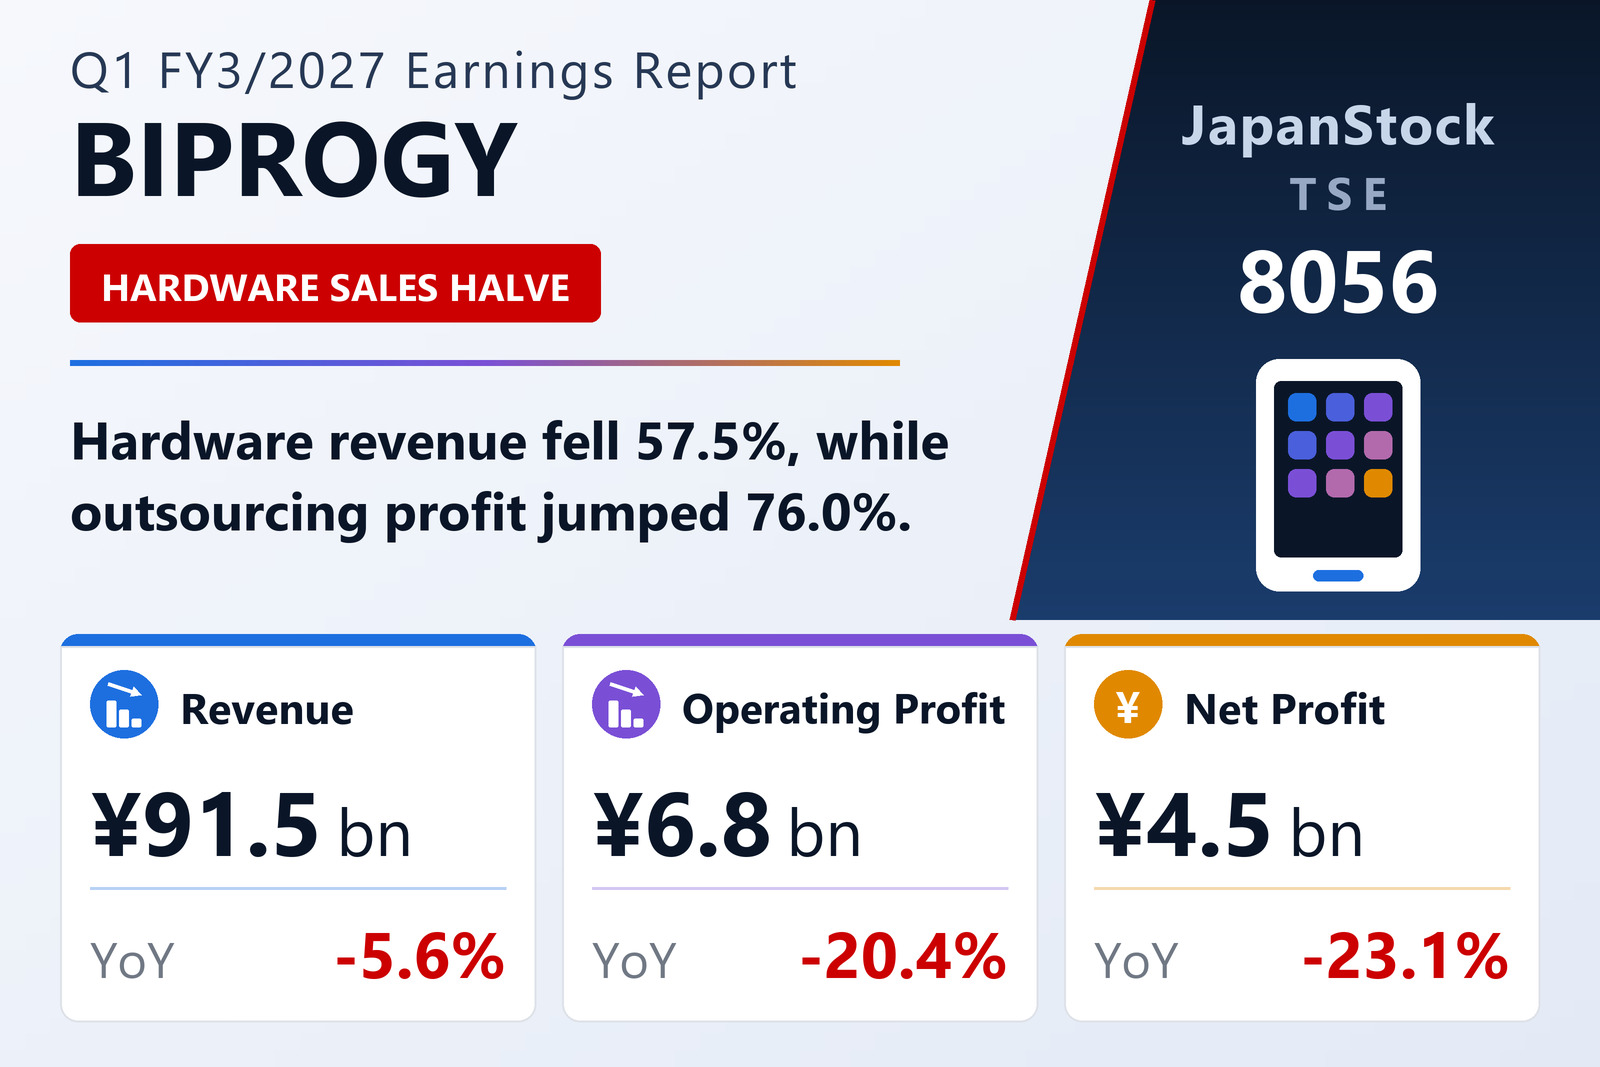
BIPROGY Inc. (TSE: 8056) published consolidated results for the three months to June 30, 2026 on August 5, 2026 under IFRS. Revenue fell 5.6% to ¥91,464 million and operating profit 20.4% to ¥6,817 million, narrowing the operating margin from 8.8% to 7.5%. Profit before tax fell 22.0% to ¥6,651 million and profit attributable to owners of the parent 23.1% to ¥4,484 million, for basic earnings per share of ¥46.42 against ¥59.42. Adjusted operating profit — the group's own management measure, revenue less cost of sales and SG&A — fell 14.7% to ¥6,688 million.
The company is explicit that customer IT investment appetite remained strong; the revenue decline came from lower product sales, and the falling revenue meant the group could not absorb higher SG&A. That distinction matters, because the segment detail shows the two halves of the business moving in opposite directions.
Outsourcing up 76%, hardware down 65%
Outsourcing was the standout: revenue rose 24.5% to ¥28,837 million and segment profit 76.0% to ¥7,390 million, an increase of ¥3.2 billion that made it the second-largest profit contributor. System services, the largest segment, grew revenue 3.6% to ¥31,178 million and profit 7.8% to ¥11,444 million.
Against that, the product-led segments collapsed. Hardware revenue fell 57.5% to ¥6,356 million and profit 65.0% to ¥961 million; software revenue fell 24.0% to ¥8,807 million and profit 84.7% to ¥163 million, all but eliminating that segment's contribution. Support services revenue slipped 2.3% to ¥13,912 million and profit 11.6% to ¥3,944 million. Combined, the two product segments gave up ¥2.7 billion of profit — more than the ¥1.8 billion the group as a whole lost.
Building the next revenue lines
BIPROGY is running its Vision2030 plan on two tracks: core businesses in five focus areas — financial, retail, energy, mobility and OT infrastructure — and growth businesses in market development, business development and global. In the financial area, the company will launch Trabotic, described as Japan's first SaaS trade-flow management service for financial institutions, from December 2026, and enter the anti-money-laundering systems market by using AI to visualise and assess transaction risk from trade-flow information behind foreign remittances.
In energy, it established a subsidiary, BIPROGY Energy Storage LLC, to own and operate grid-scale storage batteries in support of a new aggregation business trading in the wholesale power and balancing markets. In business development, a 12-company consortium including BIPROGY was selected for a Ministry of the Environment feasibility study on a stable supply system for recycled plastics for the automotive sector, with BIPROGY handling traceability, data linkage and supply-chain visualisation. The group also set up an AI Center of Excellence in FY2026 around three pillars: expanding AI solutions and services, raising development productivity, and improving business processes.
Cash flow and guidance
Operating cash flow was an inflow of ¥14,516 million, ¥7,185 million less than a year earlier, as pre-tax profit of ¥6,651 million and depreciation and amortisation of ¥4,688 million combined with a ¥30,018 million decrease in trade receivables against a ¥10,558 million decrease in trade payables. Investing activities used ¥4,095 million, mainly ¥2,120 million for intangibles centred on outsourcing software and ¥2,011 million for investment securities. Financing used ¥10,485 million, including ¥6,698 million of dividends. Cash and equivalents closed at ¥47,037 million, essentially unchanged.
Total assets fell 4.4% from the March year-end to ¥363,866 million on lower trade receivables, and liabilities fell ¥14,421 million to ¥185,188 million. The ratio of equity attributable to owners of the parent rose 1.6 points to 48.6%. Guidance is unchanged from the April 30, 2026 announcement: revenue of ¥470,000 million (+8.4%), operating profit of ¥48,400 million (+13.6%), adjusted operating profit of ¥48,400 million (+11.1%), pre-tax profit of ¥48,000 million (+9.5%) and net profit of ¥32,200 million (+3.2%). The annual dividend forecast rises to ¥140.00 per share from ¥130.00.
| Metric | Q1 FY3/2027 | Q1 FY3/2026 | Change |
|---|---|---|---|
| Revenue (¥ million) | 91,464 | 96,844 | −5.6% |
| Operating profit (¥ million) | 6,817 | 8,569 | −20.4% |
| Operating margin | 7.5% | 8.8% | −1.3 pt |
| Adjusted operating profit (¥ million) | 6,688 | 7,841 | −14.7% |
| Pre-tax profit (¥ million) | 6,651 | 8,523 | −22.0% |
| Net profit attrib. to owners of parent (¥ million) | 4,484 | 5,827 | −23.1% |
| Comprehensive income (¥ million) | 4,769 | 6,276 | −24.0% |
| EPS (¥) | 46.42 | 59.42 | −21.9% |
| System Services — revenue (¥ million) | 31,178 | 30,087 | +3.6% |
| System Services — segment profit (¥ million) | 11,444 | 10,618 | +7.8% |
| Support Services — revenue (¥ million) | 13,912 | 14,242 | −2.3% |
| Support Services — segment profit (¥ million) | 3,944 | 4,464 | −11.6% |
| Outsourcing — revenue (¥ million) | 28,837 | 23,169 | +24.5% |
| Outsourcing — segment profit (¥ million) | 7,390 | 4,199 | +76.0% |
| Software — revenue (¥ million) | 8,807 | 11,593 | −24.0% |
| Software — segment profit (¥ million) | 163 | 1,063 | −84.7% |
| Hardware — revenue (¥ million) | 6,356 | 14,966 | −57.5% |
| Hardware — segment profit (¥ million) | 961 | 2,746 | −65.0% |
| Total assets (¥ million) | 363,866 | 380,669 | −4.4% |
| Equity attrib. to owners of parent (¥ million) | 176,857 | 178,988 | −1.2% |
| Equity ratio | 48.6% | 47.0% | +1.6 pt |
| FY3/2027 guidance — revenue (¥ million) | 470,000 | — | +8.4% |
| FY3/2027 guidance — operating profit (¥ million) | 48,400 | — | +13.6% |
| FY3/2027 guidance — adjusted operating profit (¥ million) | 48,400 | — | +11.1% |
| FY3/2027 guidance — pre-tax profit (¥ million) | 48,000 | — | +9.5% |
| FY3/2027 guidance — net profit (¥ million) | 32,200 | — | +3.2% |
| Annual dividend per share (¥) | 140.00 | 130.00 | +7.7% |
JapanStockPulse provides informational content only and does not constitute investment advice. Figures are taken from the company's published earnings short report and may be subject to subsequent revision.