A 71% jump in income that is mostly portfolio activity
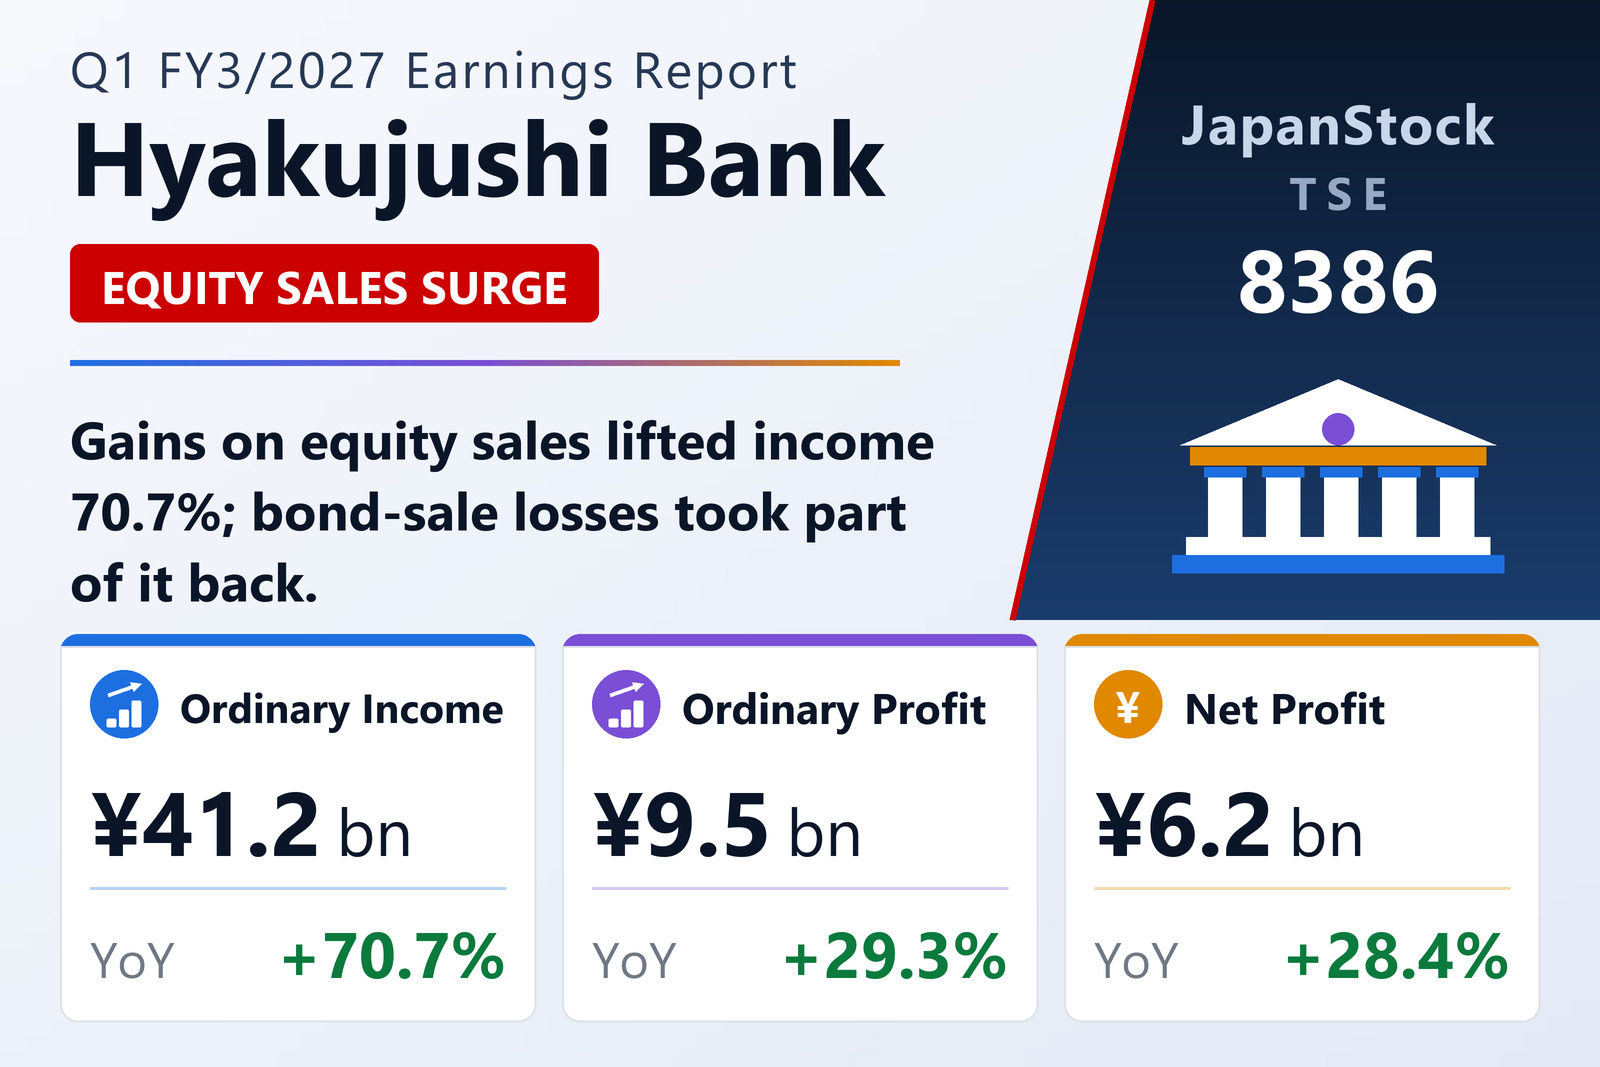
The Hyakujushi Bank, Ltd. (TSE: 8386), the Kagawa-based regional lender, published consolidated results for the three months to June 30, 2026 on August 5, 2026 under Japanese GAAP. Ordinary income rose ¥17,066 million, or 70.7%, to ¥41,221 million — an unusually large move for a regional bank in a single quarter, and one that came from two sources: higher interest income as loan interest rose, and higher other ordinary income from increased gains on sales of equity securities.
The other side of the same portfolio activity appears in costs. Ordinary expenses rose ¥14,906 million to ¥31,682 million, chiefly on higher other business expenses reflecting increased losses on sales of Japanese government bonds and similar securities. In other words, the bank realised gains on its equity holdings and losses on its bond holdings in the same quarter, and most of the headline income growth was consumed by the offsetting expense.
What survived to the bottom line was still a solid increase. Ordinary profit rose ¥2,161 million, or 29.3%, to ¥9,539 million, against 5.7% growth a year earlier, and net profit attributable to owners of the parent rose ¥1,368 million, or 28.4%, to ¥6,179 million. Earnings per share were ¥54.64 against ¥42.32.
Comprehensive income tells the other half of the story: it fell 26.8% to ¥8,025 million from ¥10,957 million. Realising gains on securities moves value out of unrealised valuation reserves and into profit, so a quarter of heavy portfolio turnover can show rising net profit and falling comprehensive income at the same time.
Balance sheet
Total assets rose ¥25.4 billion from the March year-end to ¥5,871.2 billion on higher cash and due from banks and higher loans. Liabilities rose ¥20.9 billion to ¥5,482.3 billion on higher deposits and negotiable certificates of deposit. Net assets rose ¥4.4 billion to ¥388.8 billion.
The equity ratio was 6.6%, unchanged. The bank notes that this figure is calculated as period-end net assets less subscription rights divided by total assets, and is not the regulatory capital adequacy ratio defined under Japan's capital adequacy notification.
A four-for-one split, and unchanged guidance
The bank carried out a four-for-one common stock split effective April 1, 2026. Earnings per share for both periods are calculated as though the split had occurred at the start of the prior fiscal year, so the ¥54.64 and ¥42.32 figures are comparable. The dividend line is not: the ¥234.00 paid for FY3/2026 is the actual pre-split amount, while the ¥70.00 forecast for FY3/2027 is post-split. On a split-adjusted basis the prior year equates to ¥58.50, so the forecast represents an increase of roughly 20%.
Guidance is unchanged from the figures published on May 12, 2026. For the first half the bank guides to ordinary income of ¥59,500 million (+20.5%), ordinary profit of ¥16,500 million (+21.7%) and net profit of ¥11,000 million (+23.0%), for earnings per share of ¥97.27. For the full year it guides to ordinary income of ¥116,500 million (+7.3%), ordinary profit of ¥33,000 million (+13.3%) and net profit of ¥21,000 million (+11.4%), for earnings per share of ¥185.69. First-quarter ordinary profit represents 28.9% of the full-year target.
| Metric | Q1 FY3/2027 | Q1 FY3/2026 | Change |
|---|---|---|---|
| Operating revenue (¥ million) | 41,221 | 24,155 | +70.7% |
| Ordinary profit (¥ million) | 9,539 | 7,378 | +29.3% |
| Net profit attrib. to owners of parent (¥ million) | 6,179 | 4,811 | +28.4% |
| Comprehensive income (¥ million) | 8,025 | 10,957 | −26.8% |
| EPS (¥) | 54.64 | 42.32 | +29.1% |
| Total assets (¥ million) | 5,871,236 | 5,845,803 | +0.4% |
| Net assets (¥ million) | 388,877 | 384,426 | +1.2% |
| Equity ratio | 6.6% | 6.6% | unchanged |
| FY3/2027 guidance — operating revenue (¥ million) | 116,500 | — | +7.3% |
| FY3/2027 guidance — ordinary profit (¥ million) | 33,000 | — | +13.3% |
| FY3/2027 guidance — net profit (¥ million) | 21,000 | — | +11.4% |
| FY3/2027 guidance — EPS (¥) | 185.69 | — | n.m. |
| Annual dividend per share (¥) | 70.00 | 234.00 | n.m. |
JapanStockPulse provides informational content only and does not constitute investment advice. Figures are taken from the company's published earnings short report and may be subject to subsequent revision.