Loan interest drives a 25% rise in ordinary income
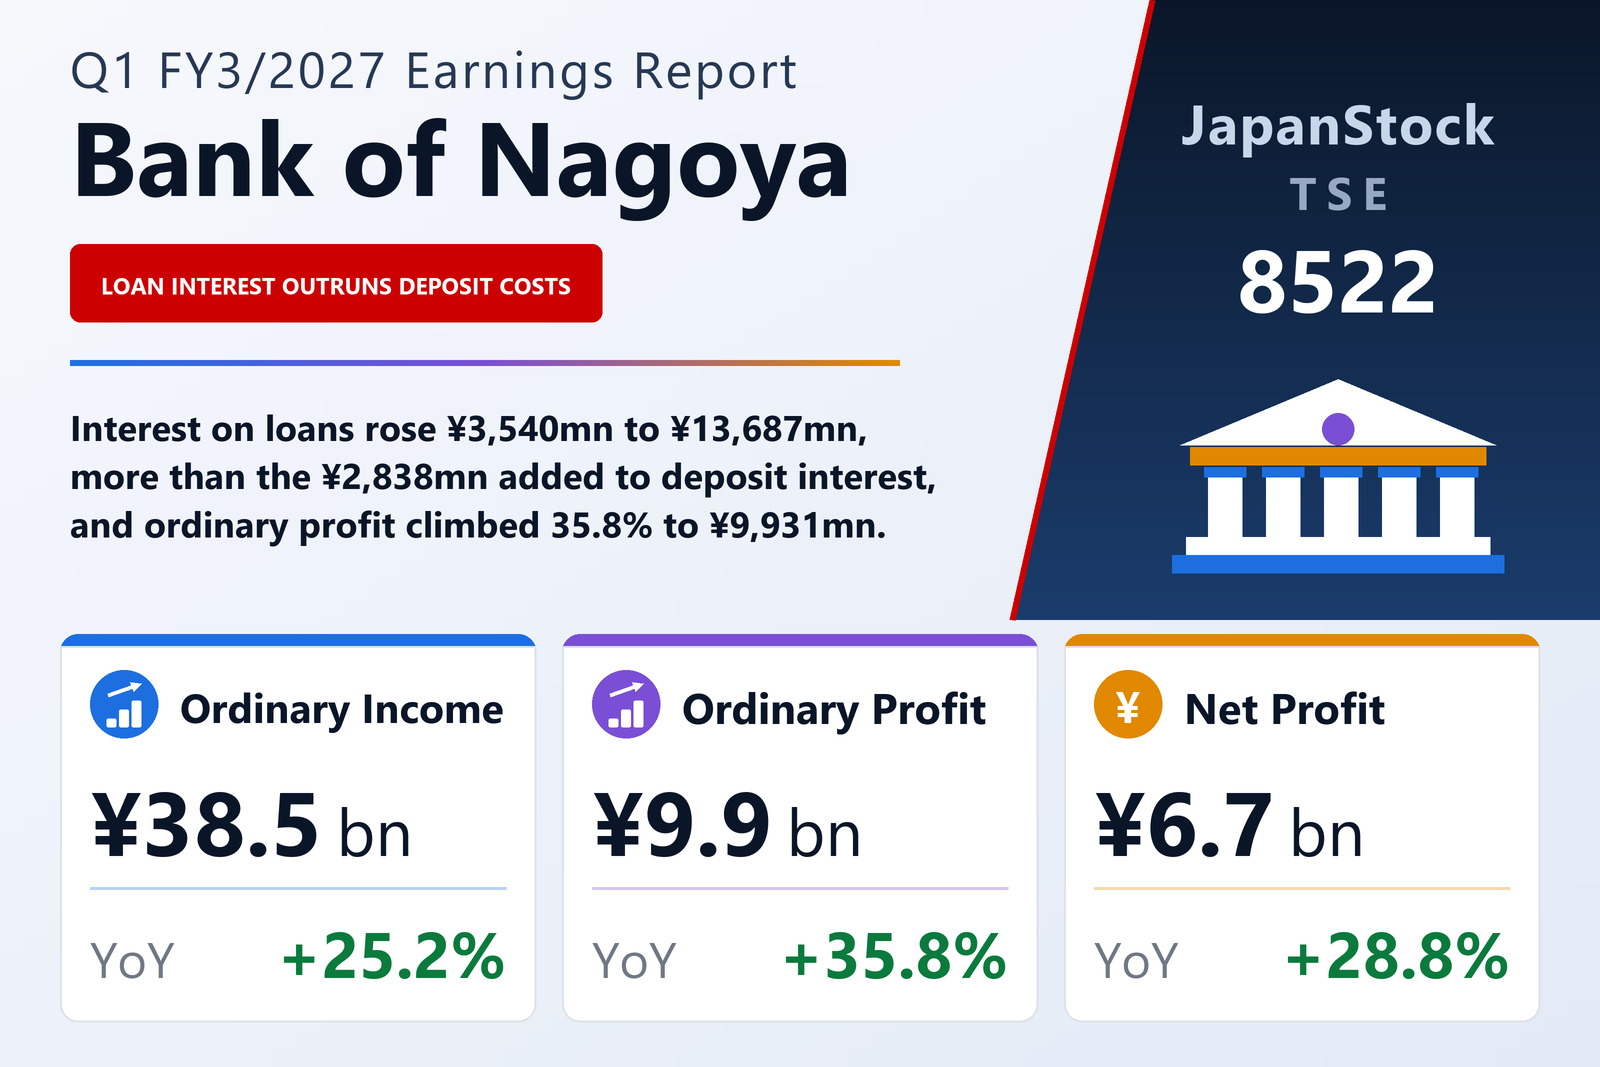
The Bank of Nagoya, Ltd. (TSE: 8522), a regional bank whose shares are listed in Tokyo and Nagoya, published consolidated first-quarter results for FY3/2027 on August 5, 2026, covering April 1 to June 30, 2026 under Japanese GAAP. Ordinary income rose 25.2% to ¥38,502 million, ordinary profit 35.8% to ¥9,931 million and net profit attributable to owners of the parent 28.8% to ¥6,744 million. Earnings per share came to ¥137.09 against ¥106.45; the prior-year figure is calculated as if the three-for-one stock split that took effect on October 1, 2025 had happened at the start of the previous fiscal year. The comparison base was not a weak one: in the same quarter a year earlier ordinary income had grown 22.1%, ordinary profit 24.8% and net profit 28.8%.
The bank names higher interest on loans as the main reason ordinary income grew. Interest income rose 33.3% to ¥22,226 million, with interest on loans up 34.9% to ¥13,687 million and interest and dividends on securities up 33.9% to ¥7,397 million. Fees and commissions income added 21.5% to ¥3,851 million, other business income 8.1% to ¥7,483 million and other ordinary income 24.0% to ¥4,921 million.
Deposit interest nearly doubles
Ordinary expenses grew 21.9% to ¥28,570 million, which the bank attributes mainly to higher interest on deposits and larger losses on sales of government and other bonds. Funding costs rose 56.7% to ¥6,894 million, and within them interest on deposits climbed 97.5% to ¥5,750 million from ¥2,912 million. Other business expenses, the line that carries losses on bond sales, rose 20.5% to ¥11,026 million, and general and administrative expenses 7.9% to ¥8,707 million. With ordinary income up ¥7,756 million and ordinary expenses up ¥5,138 million, ordinary profit rose by ¥2,618 million. In yen terms, interest on loans added ¥3,540 million while interest on deposits added ¥2,838 million.
Net profit grew more slowly than ordinary profit for reasons visible in the income statement. The prior-year quarter included a ¥281 million gain on disposal of fixed assets, against ¥3 million this time, so profit before income taxes rose a smaller 31.3% to ¥9,934 million. Income taxes rose 36.7% to ¥3,190 million, equal to 32.1% of pre-tax profit against 30.8% a year earlier; the bank estimates quarterly tax expense by applying its expected effective tax rate for the full year. Comprehensive income fell 12.4% to ¥6,959 million, because other comprehensive income shrank to ¥215 million from ¥2,707 million as the valuation difference on available-for-sale securities added only ¥251 million against ¥2,968 million.
Core business net profit up 42.8% at the parent bank
The non-consolidated figures in the supplementary material show the same pattern. Net interest income rose 23.1% to ¥16,213 million and net fees and commissions 31.5% to ¥2,611 million, while net losses on government and other bonds widened to ¥4,762 million from ¥3,245 million. Core business net profit, which excludes those bond gains and losses, rose 42.8% to ¥10,680 million, or 43.0% to ¥10,646 million excluding gains and losses on cancellation of investment trusts. Net gains on equities and related instruments increased 25.8% to ¥4,754 million, and credit-related costs were ¥514 million against ¥485 million. Risk-monitored and Financial Reconstruction Act disclosed loans totalled ¥78,238 million, 1.75% of the loans covered, down from 1.95% a year earlier and 1.79% at March 31, 2026.
Banking carries the segments; other businesses deepen their loss
Banking, by far the largest segment, lifted ordinary income including inter-segment transactions by 29.1% to ¥32,029 million and segment profit by 33.3% to ¥10,417 million. Leasing grew ordinary income 10.3% to ¥6,302 million and profit 27.0% to ¥146 million, and the card business 7.4% to ¥681 million and 9.7% to ¥226 million. The businesses outside the reportable segments, which include medical systems and ICT support, saw ordinary income fall 18.4% to ¥546 million and their loss widen to ¥113 million from ¥4 million. The filing gives no reason for the individual segment movements beyond the figures.
Loans grow, cash and certificates of deposit shrink
Total assets fell 1.1% to ¥6,205,315 million from March 31, 2026. Loans and bills discounted grew 1.6%, or ¥67,513 million, to ¥4,377,807 million, which the bank attributes to actively meeting the funding needs of local companies and individual borrowers, centred on housing loans. Deposits slipped ¥4,003 million to ¥5,377,203 million, including a ¥3,381 million decline in individual deposits, and negotiable certificates of deposit fell to ¥20,500 million from ¥86,500 million. Cash and due from banks dropped to ¥618,921 million from ¥767,469 million, while securities rose 1.1% to ¥1,058,494 million. The filing does not comment on the cash or certificate-of-deposit movements.
Net assets rose 0.3% to ¥314,945 million and the equity ratio to 5.1% from 5.0%. The bank stresses that this ratio is net assets divided by total assets and is not the capital adequacy ratio defined by Japan's capital adequacy notification. The preliminary regulatory figures in the supplementary material put the consolidated total capital ratio at 13.09% at June 30, 2026 against 12.93% at March 31, 2026, with the Tier 1 and common equity Tier 1 ratios both at 11.87%. At the parent bank, unrealized gains on available-for-sale securities stood at ¥96,433 million against ¥73,034 million a year earlier, as net unrealized gains of ¥109,734 million on equities outweighed net unrealized losses of ¥22,902 million on bonds. Year on year, parent-bank loans were 9.7% higher at ¥4,400,356 million and deposits including certificates of deposit 5.3% higher at ¥5,407,025 million.
Guidance and ¥200 dividend forecast unchanged
The consolidated forecasts published on May 12, 2026 were left unchanged. For the first half the bank expects ordinary income of ¥72,800 million (+20.5%), ordinary profit of ¥15,900 million (+24.8%) and net profit of ¥10,900 million (+19.2%); for the full year, ordinary income of ¥142,800 million (+14.7%), ordinary profit of ¥33,700 million (+20.0%) and net profit of ¥23,000 million (+13.5%), for earnings per share of ¥467.50. First-quarter ordinary profit equals 29.5% of the full-year target and 62.5% of the first-half target; net profit equals 29.3% and 61.9%.
The dividend forecast is also unchanged, at ¥100 interim and ¥100 year-end, or ¥200 for the year. Adjusted for the stock split, FY3/2026 paid ¥50 interim and ¥120 year-end, a total of ¥170, so the forecast is 17.6% higher; without the split adjustment, the prior year's year-end dividend would have been ¥360 and the annual total ¥510.
| Metric | Q1 FY3/2027 | Q1 FY3/2026 | Change |
|---|---|---|---|
| Ordinary income (¥ million) | 38,502 | 30,745 | +25.2% |
| — interest income (¥ million) | 22,226 | 16,676 | +33.3% |
| —— interest on loans (¥ million) | 13,687 | 10,147 | +34.9% |
| —— interest and dividends on securities (¥ million) | 7,397 | 5,526 | +33.9% |
| — fees and commissions income (¥ million) | 3,851 | 3,170 | +21.5% |
| — other business income (¥ million) | 7,483 | 6,923 | +8.1% |
| Ordinary expenses (¥ million) | 28,570 | 23,432 | +21.9% |
| — funding costs (¥ million) | 6,894 | 4,400 | +56.7% |
| —— interest on deposits (¥ million) | 5,750 | 2,912 | +97.5% |
| — other business expenses (¥ million) | 11,026 | 9,147 | +20.5% |
| — general and administrative expenses (¥ million) | 8,707 | 8,070 | +7.9% |
| Ordinary profit (¥ million) | 9,931 | 7,313 | +35.8% |
| Net profit attrib. to owners of parent (¥ million) | 6,744 | 5,235 | +28.8% |
| Comprehensive income (¥ million) | 6,959 | 7,942 | −12.4% |
| EPS (¥) | 137.09 | 106.45 | +28.8% |
| Banking — ordinary income (¥ million) | 32,029 | 24,809 | +29.1% |
| Banking — segment profit (¥ million) | 10,417 | 7,812 | +33.3% |
| Leasing — ordinary income (¥ million) | 6,302 | 5,715 | +10.3% |
| Leasing — segment profit (¥ million) | 146 | 115 | +27.0% |
| Card — ordinary income (¥ million) | 681 | 634 | +7.4% |
| Card — segment profit (¥ million) | 226 | 206 | +9.7% |
| Other — ordinary income (¥ million) | 546 | 669 | −18.4% |
| Other — segment profit (¥ million) | −113 | −4 | loss widened |
| Total assets (¥ million) | 6,205,315 | 6,272,701 | −1.1% |
| Deposits (¥ million) | 5,377,203 | 5,381,207 | −0.1% |
| Negotiable certificates of deposit (¥ million) | 20,500 | 86,500 | −76.3% |
| Loans and bills discounted (¥ million) | 4,377,807 | 4,310,294 | +1.6% |
| Securities (¥ million) | 1,058,494 | 1,047,374 | +1.1% |
| Net assets (¥ million) | 314,945 | 313,890 | +0.3% |
| Equity ratio | 5.1% | 5.0% | +0.1 pt |
| Total capital ratio (consolidated, regulatory) | 13.09% | 12.93% | +0.16 pt |
| FY3/2027 guidance — ordinary income (¥ million) | 142,800 | — | +14.7% |
| FY3/2027 guidance — ordinary profit (¥ million) | 33,700 | — | +20.0% |
| FY3/2027 guidance — net profit (¥ million) | 23,000 | — | +13.5% |
| FY3/2027 guidance — EPS (¥) | 467.50 | — | — |
| Annual dividend per share (¥) | 200.00 | 170.00 | +17.6% |
JapanStockPulse provides informational content only and does not constitute investment advice. Figures are taken from the company's published earnings short report and may be subject to subsequent revision.