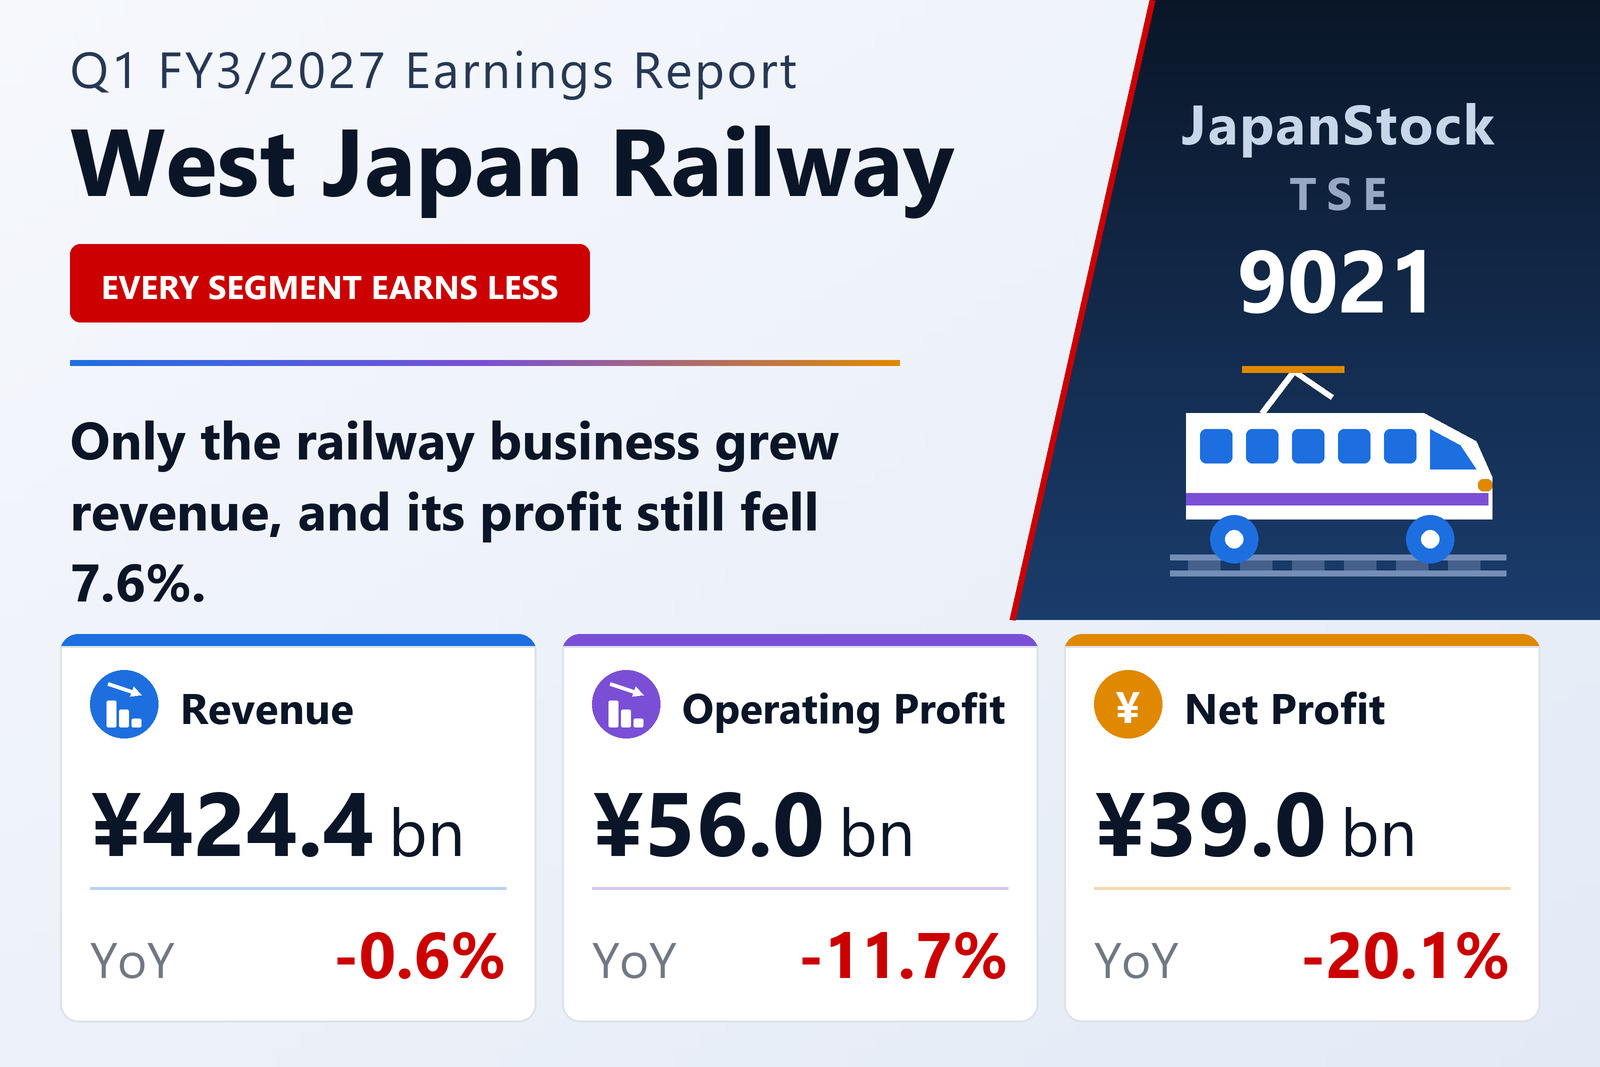
Profit fell faster than revenue
West Japan Railway Company (TSE: 9021) published consolidated results for the three months to June 30, 2026 on August 5, 2026 under Japanese GAAP. Revenue edged down 0.6% to ¥424,403 million — after a 6.0% increase a year earlier — while operating profit fell 11.7% to ¥55,989 million, narrowing the operating margin from 14.8% to 13.2%. Ordinary profit fell 12.7% to ¥52,125 million and net profit attributable to owners of the parent 20.1% to ¥39,046 million, for earnings per share of ¥85.80 against ¥104.54.
The gap between the revenue line and the profit line is the story of the quarter: essentially flat sales produced a double-digit profit decline, and the drop steepened further below the operating line. Comprehensive income fell 20.3% to ¥40,031 million. The company's own qualitative discussion is not carried in the earnings short report; JR West directs readers to a separate supplementary document, 2026 First-Quarter Results, disclosed on TDnet the same day.
Mobility grew revenue; nothing grew profit
Mobility — the railway business and the group's largest segment by a wide margin — was the only one to grow, lifting segment revenue 3.6% to ¥274,786 million. Even so its profit fell 7.6% to ¥40,153 million, so the whole group's profit decline is not explained by weakness in rail volumes.
The three non-rail segments all shrank on both lines. Retail revenue fell 4.8% to ¥55,113 million and profit 26.4% to ¥3,755 million — the steepest proportional decline in the group. Real estate revenue fell 7.8% to ¥63,687 million and profit 16.6% to ¥12,065 million, still the second-largest profit contributor at ¥12.1 billion. Travel and regional solutions remained loss-making, with the loss widening slightly to ¥742 million from ¥636 million on revenue down 5.9%. Other businesses, mainly advertising, contributed ¥595 million of profit against ¥839 million.
Guidance unchanged — and it implies a much weaker year
JR West left its FY3/2027 forecast unchanged from the figures published on May 12, 2026. It guides to revenue of ¥1,829,000 million (−0.9%), operating profit of ¥165,000 million (−16.7%), ordinary profit of ¥145,000 million (−21.1%) and net profit of ¥100,000 million (−21.6%), for earnings per share of ¥219.74. The annual dividend forecast is unchanged at ¥97.50 per share, though its split shifts to ¥48.50 interim and ¥49.00 year-end from ¥45.00 and ¥52.50.
Set against the quarter, that guidance is internally consistent rather than cautious: a 16.7% full-year decline in operating profit is steeper than the 11.7% just reported, so the company is not assuming the first quarter marks the low point. First-quarter operating profit represents 33.9% of the full-year target — a normal-looking progression for a business whose earnings are weighted toward the second half.
Balance sheet and scope
Total assets fell 2.2% from the March year-end to ¥3,899,988 million, while net assets rose 1.3% to ¥1,354,238 million, lifting the equity ratio to 31.4% from 30.3%. Shareholders' equity stood at ¥1,224,128 million against ¥1,207,706 million. One company, JR West Real Estate Management Co., Ltd., was newly added to the scope of consolidation during the quarter.
| Metric | Q1 FY3/2027 | Q1 FY3/2026 | Change |
|---|---|---|---|
| Net sales (¥ million) | 424,403 | 427,059 | −0.6% |
| Operating profit (¥ million) | 55,989 | 63,386 | −11.7% |
| Operating margin | 13.2% | 14.8% | −1.6 pt |
| Ordinary profit (¥ million) | 52,125 | 59,704 | −12.7% |
| Net profit attrib. to owners of parent (¥ million) | 39,046 | 48,842 | −20.1% |
| Comprehensive income (¥ million) | 40,031 | 50,220 | −20.3% |
| EPS (¥) | 85.80 | 104.54 | −17.9% |
| Mobility — revenue (¥ million) | 274,786 | 265,114 | +3.6% |
| Mobility — segment profit (¥ million) | 40,153 | 43,478 | −7.6% |
| Retail — revenue (¥ million) | 55,113 | 57,865 | −4.8% |
| Retail — segment profit (¥ million) | 3,755 | 5,104 | −26.4% |
| Real Estate — revenue (¥ million) | 63,687 | 69,079 | −7.8% |
| Real Estate — segment profit (¥ million) | 12,065 | 14,461 | −16.6% |
| Travel & Regional Solutions — revenue (¥ million) | 41,375 | 43,975 | −5.9% |
| Travel & Regional Solutions — segment profit (¥ million) | −742 | −636 | loss widened |
| Total assets (¥ million) | 3,899,988 | 3,986,721 | −2.2% |
| Net assets (¥ million) | 1,354,238 | 1,337,206 | +1.3% |
| Equity ratio | 31.4% | 30.3% | +1.1 pt |
| FY3/2027 guidance — revenue (¥ million) | 1,829,000 | — | −0.9% |
| FY3/2027 guidance — operating profit (¥ million) | 165,000 | — | −16.7% |
| FY3/2027 guidance — ordinary profit (¥ million) | 145,000 | — | −21.1% |
| FY3/2027 guidance — net profit (¥ million) | 100,000 | — | −21.6% |
| Annual dividend per share (¥) | 97.50 | 97.50 | unchanged |
JapanStockPulse provides informational content only and does not constitute investment advice. Figures are taken from the company's published earnings short report and may be subject to subsequent revision.