A geopolitical shock that ran in NYK's favour
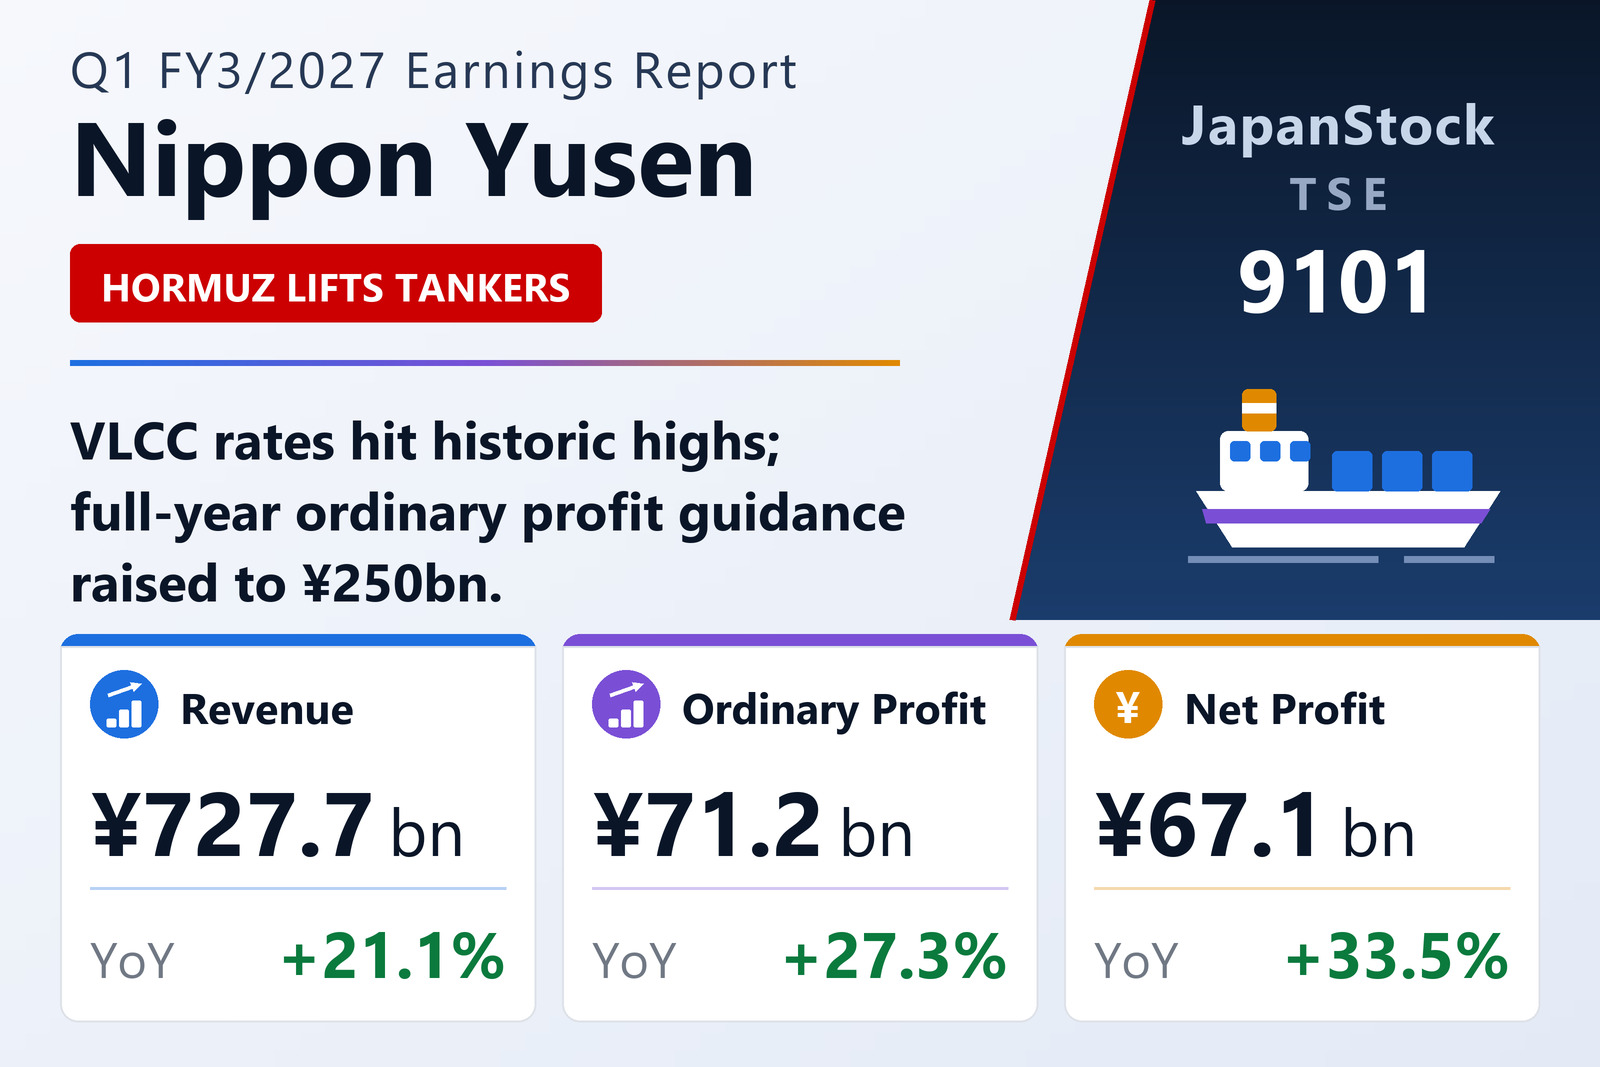
Nippon Yusen Kabushiki Kaisha (TSE: 9101) published consolidated results for the three months to June 30, 2026 on August 5, 2026 under Japanese GAAP. Revenue rose 21.1% to ¥727,656 million and operating profit 69.8% to ¥57,708 million, widening the operating margin from 5.7% to 7.9%. Ordinary profit rose 27.3% to ¥71,222 million and net profit attributable to owners of the parent 33.5% to ¥67,109 million, for earnings per share of ¥166.10 against ¥116.74. Comprehensive income was ¥100,567 million, against a loss of ¥20,016 million a year earlier.
Two external variables did most of the work. The average exchange rate moved from ¥145.32 to ¥159.89 to the dollar, and the average bunker price the company consumed rose from US$578.60 to US$722.71 per tonne — both consequences, in part, of the closure of the Strait of Hormuz that runs through this entire set of results. Equity-method investment income of ¥16.5 billion was recorded in non-operating income, of which ¥1.3 billion came from Ocean Network Express Pte. Ltd. (ONE), the container joint venture.
Energy and dry bulk carried the quarter
The energy segment nearly doubled its profit, to ¥23.9 billion from ¥12.0 billion, on revenue up 38.8% to ¥66.7 billion. VLCC rates reached what the company calls historic highs; VLGC and product tankers benefited as North American cargoes replaced reduced Middle East shipments, lengthening voyage distances and tightening tonnage supply. LNG carriers held steady on medium- and long-term contracts, while the offshore business lost a one-off gain booked a year earlier on a new FPSO start-up.
Dry bulk swung from a ¥2.7 billion loss to a ¥19.4 billion profit on revenue up 28.7% to ¥174.8 billion, as markets across every vessel class ran well above the year-earlier level, helped by the weaker yen and by valuation effects from the sharp rise in fuel prices.
But the closure cut the other way in autos and logistics
The automotive segment shows the cost side of the same event. Volumes held roughly flat and revenue rose 12.7% to ¥144.3 billion on the weaker yen, but profit fell 41.7% to ¥16.8 billion as rerouting around the closed strait, higher fuel costs and port congestion pushed up operating expenses.
Logistics grew revenue 46.4% to ¥271.1 billion but swung to a ¥2.4 billion loss from a ¥3.2 billion profit. Air freight forwarding was strong on Asia-Pacific demand, but ocean freight forwarding saw purchase prices rise ahead of rates, and the logistics business booked goodwill amortisation from the healthcare-logistics acquisition made in Europe during 2025. Liner trade grew revenue 5.9% to ¥47.1 billion but saw profit fall to ¥10.0 billion from ¥12.0 billion, as higher fuel costs outweighed freight rates that were above the year-earlier level. Other businesses swung to a ¥4.5 billion profit on revenue down 29.9%, helped by a strong bunker-sales business and by the cruise line now operating two ships following the full entry into service of Asuka III.
Guidance raised sharply, on an explicit assumption
NYK raised both its first-half and full-year forecasts. For the full year it now guides to revenue of ¥2,881,000 million against ¥2,605,000 million previously, operating profit of ¥185,000 million against ¥145,000 million, ordinary profit of ¥250,000 million against ¥185,000 million and net profit of ¥240,000 million against ¥195,000 million. The annual dividend forecast rises to ¥240.00 per share from ¥230.00.
The segment forecasts rest on an explicit assumption: that the closure of the Strait of Hormuz continues until the end of September 2026. Container shipping is expected to beat the initial plan on firmer freight markets, with the further assumption that Cape of Good Hope routing in place of the Suez Canal continues through the year. Dry bulk and the tanker businesses are also expected to run above plan. Against that, automotive is guided below the initial plan because the closure is now assumed to last longer than first expected, and logistics is guided below plan on lower North American volumes and higher spending for business expansion.
Balance sheet
Total assets rose ¥195.1 billion from the March year-end to ¥5,396,846 million on higher construction in progress and investment securities. Interest-bearing debt rose ¥160.1 billion to ¥1,361.6 billion, taking total liabilities to ¥2,215.2 billion. Shareholders' equity reached ¥3,114.7 billion and total net assets ¥3,181,605 million including ¥66.9 billion of non-controlling interests. The debt-to-equity ratio stood at 0.44 and the equity ratio at 57.7%, down from 59.1%.
| Metric | Q1 FY3/2027 | Q1 FY3/2026 | Change |
|---|---|---|---|
| Net sales (¥ million) | 727,656 | 600,926 | +21.1% |
| Operating profit (¥ million) | 57,708 | 33,976 | +69.8% |
| Operating margin | 7.9% | 5.7% | +2.2 pt |
| Ordinary profit (¥ million) | 71,222 | 55,943 | +27.3% |
| Net profit attrib. to owners of parent (¥ million) | 67,109 | 50,287 | +33.5% |
| Comprehensive income (¥ million) | 100,567 | −20,016 | loss to profit |
| EPS (¥) | 166.10 | 116.74 | +42.3% |
| Liner Trade — revenue (¥ million) | 47,100 | 44,500 | +5.9% |
| Liner Trade — segment profit (¥ million) | 10,000 | 12,000 | −16.7% |
| Logistics — revenue (¥ million) | 271,100 | 185,200 | +46.4% |
| Logistics — segment profit (¥ million) | −2,400 | 3,200 | profit to loss |
| Automotive — revenue (¥ million) | 144,300 | 128,000 | +12.7% |
| Automotive — segment profit (¥ million) | 16,800 | 28,800 | −41.7% |
| Dry Bulk — revenue (¥ million) | 174,800 | 135,800 | +28.7% |
| Dry Bulk — segment profit (¥ million) | 19,400 | −2,700 | loss to profit |
| Energy — revenue (¥ million) | 66,700 | 48,100 | +38.8% |
| Energy — segment profit (¥ million) | 23,900 | 12,000 | +99.2% |
| Other — revenue (¥ million) | 57,400 | 81,900 | −29.9% |
| Other — segment profit (¥ million) | 4,500 | 2,900 | +55.2% |
| Total assets (¥ million) | 5,396,846 | 5,201,670 | +3.8% |
| Net assets (¥ million) | 3,181,605 | 3,143,437 | +1.2% |
| Equity ratio | 57.7% | 59.1% | −1.4 pt |
| FY3/2027 guidance — revenue (¥ million) | 2,881,000 | — | +18.9% |
| FY3/2027 guidance — operating profit (¥ million) | 185,000 | — | +33.5% |
| FY3/2027 guidance — ordinary profit (¥ million) | 250,000 | — | +18.4% |
| FY3/2027 guidance — net profit (¥ million) | 240,000 | — | +13.3% |
| Annual dividend per share (¥) | 240.00 | 230.00 | +4.3% |
JapanStockPulse provides informational content only and does not constitute investment advice. Figures are taken from the company's published earnings short report and may be subject to subsequent revision.