An advertising slowdown reached the operating line through revenue
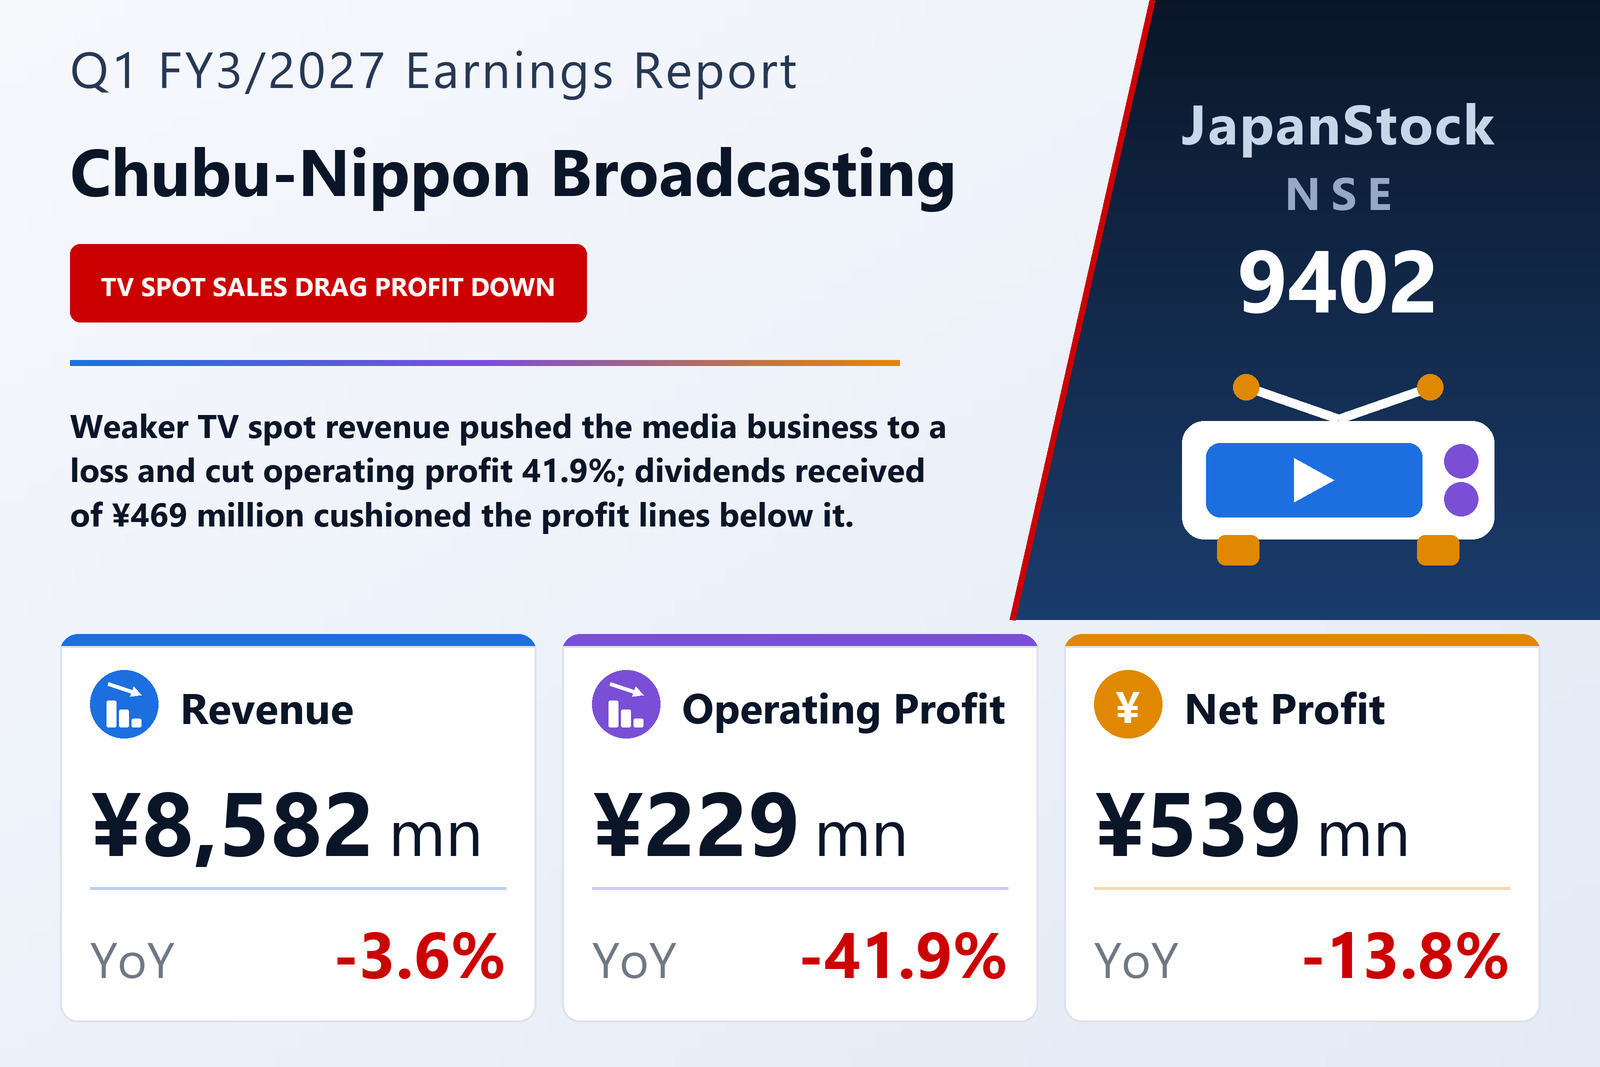
Chubu-Nippon Broadcasting Co., Ltd. (NSE: 9402), the broadcasting group whose filing breaks out sales at CBC Television and CBC Radio, published consolidated first-quarter results for FY3/2027 — the three months from April 1 to June 30, 2026 — under Japanese GAAP on August 5, 2026. Net sales fell 3.6% to ¥8,582 million, operating profit 41.9% to ¥229 million, ordinary profit 5.8% to ¥718 million and profit attributable to owners of the parent 13.8% to ¥539 million, for earnings of ¥20.70 per share against ¥23.72. The filing names the Nagoya Stock Exchange as its listing exchange.
The filing gives one cause: the advertising market, which it identifies as the market that most affects the group, slowed during the quarter amid uncertain business sentiment. That reached the income statement almost entirely through revenue. Cost of sales was essentially flat, at ¥5,255 million against ¥5,247 million, so the ¥317 million fall in net sales passed through to gross profit, which dropped 8.9% to ¥3,327 million; the gross margin narrowed from 41.0% to 38.8%. Selling, general and administrative expenses were cut 4.9% to ¥3,097 million, a saving of ¥160 million that absorbed about half of the ¥325 million gross-profit decline. The operating margin still fell from 4.4% to 2.7%.
Television spot sales carried the decline
The group reports two segments plus an Other category. Media Content, much the largest, recorded external sales of ¥7,844 million, down 4.0%, which the filing attributes to lower television spot and time revenue, and it swung to a segment operating loss of ¥118 million from a profit of ¥73 million a year earlier — mainly, the filing says, because of the fall in TV spot revenue. That ¥191 million swing is larger than the group's entire ¥165 million fall in operating profit; both of the other businesses improved.
The reference tables at the back of the filing show where the pressure sat. At CBC Television, television revenue fell 7.6% to ¥5,564 million: spot revenue declined 9.1% to ¥3,126 million, time revenue 5.2% to ¥1,905 million and BP revenue 21.7% to ¥148 million. Event revenue rose 12.6% to ¥395 million and cross-media revenue 9.6% to ¥179 million, but from bases far too small to offset that, and the company's total sales fell 6.0% to ¥6,343 million. CBC Radio moved the other way, with sales up 1.3% to ¥556 million as spot revenue rose 10.9% to ¥188 million while time revenue slipped 3.8% to ¥357 million.
Property and the smaller businesses added profit
Real Estate grew sales 2.0% to ¥480 million and segment profit 4.5% to ¥292 million, which the filing credits to vacancies being filled at rental buildings in Tokyo and in Sakae, Nagoya. On its own, that segment earned more than the group's entire operating profit. The Other category — which includes golf-course operation, insurance agency and office-equipment sales — posted sales of ¥257 million, up 0.5%, and profit of ¥54 million, up 33.7%.
Dividend income held up ordinary profit
Below the operating line the picture changes, because the group's shareholdings earn more than its trading did this quarter. Non-operating income rose to ¥490 million from ¥372 million, almost entirely on dividends received of ¥469 million against ¥350 million — roughly twice operating profit. Non-operating expenses were negligible. Ordinary profit therefore fell only 5.8%, to ¥718 million.
The fall in net profit was steeper, at 13.8%, partly because the prior-year quarter included a ¥167 million gain on the sale of fixed assets that did not recur; this quarter's extraordinary gains were ¥10 million from selling investment securities. Pre-tax profit fell to ¥729 million from ¥931 million, income taxes to ¥173 million from ¥290 million, and profit to ¥555 million, of which ¥16 million was attributable to non-controlling interests. Comprehensive income rose 62.1% to ¥3,213 million, driven by a ¥2,694 million gain in the valuation difference on available-for-sale securities as the market value of shareholdings rose.
Higher share prices lifted the balance sheet while cash fell
Total assets rose ¥871 million from March 31 to ¥102,425 million. Investment securities increased by ¥4,226 million to ¥41,275 million on the higher market value of shares held, while cash and deposits fell ¥2,684 million to ¥11,466 million and notes and accounts receivable by ¥1,325 million. Liabilities fell ¥815 million to ¥20,908 million, with accrued expenses down ¥1,695 million and income taxes payable down ¥568 million, partly offset by a ¥1,223 million rise in deferred tax liabilities. Net assets rose ¥1,687 million to ¥81,517 million and the equity ratio climbed from 77.1% to 78.2%.
The company also bought back its own shares: the filing cites ¥584 million of treasury-stock acquisitions, and treasury shares rose from 71,797 at March 31 to 571,797 at June 30. No quarterly cash-flow statement was prepared; depreciation for the quarter was ¥454 million against ¥421 million a year earlier.
Guidance and dividend forecast unchanged
Full-year guidance, published on May 15, 2026, was not revised. For FY3/2027 the company expects net sales of ¥35,810 million, up 2.5%, operating profit of ¥1,790 million, down 12.3%, ordinary profit of ¥2,650 million, down 6.5%, and profit attributable to owners of the parent of ¥1,540 million, down 16.1%, or ¥58.49 per share. The first quarter delivered 24.0% of the full-year sales target but only 12.8% of the operating-profit target, against 27.1% of ordinary profit and 35.0% of net profit; the filing gives no quarterly phasing for the forecast.
The dividend forecast was also left unchanged at ¥25.00 per share for the year — ¥5.00 at the interim and ¥20.00 at the year-end — against ¥28.00 for FY3/2026, which comprised ¥5.00 at the interim and ¥23.00 at the year-end.
| Metric | Q1 FY3/2027 | Q1 FY3/2026 | Change |
|---|---|---|---|
| Revenue (¥ million) | 8,582 | 8,899 | −3.6% |
| Gross profit (¥ million) | 3,327 | 3,652 | −8.9% |
| Gross margin | 38.8% | 41.0% | −2.2 pt |
| SG&A expenses (¥ million) | 3,097 | 3,257 | −4.9% |
| Operating profit (¥ million) | 229 | 394 | −41.9% |
| Operating margin | 2.7% | 4.4% | −1.7 pt |
| Ordinary profit (¥ million) | 718 | 763 | −5.8% |
| Net profit attrib. to owners of parent (¥ million) | 539 | 626 | −13.8% |
| EPS (¥) | 20.70 | 23.72 | −12.7% |
| Comprehensive income (¥ million) | 3,213 | 1,982 | +62.1% |
| Media Content — revenue (¥ million) | 7,844 | 8,172 | −4.0% |
| Media Content — segment profit (¥ million) | −118 | 73 | profit to loss |
| Real Estate — revenue (¥ million) | 480 | 471 | +2.0% |
| Real Estate — segment profit (¥ million) | 292 | 280 | +4.5% |
| Other businesses — revenue (¥ million) | 257 | 256 | +0.5% |
| Other businesses — segment profit (¥ million) | 54 | 41 | +33.7% |
| CBC Television — TV spot revenue (¥ million) | 3,126 | 3,440 | −9.1% |
| CBC Television — TV time revenue (¥ million) | 1,905 | 2,010 | −5.2% |
| Cash and deposits (¥ million) | 11,466 | 14,151 | −19.0% |
| Investment securities (¥ million) | 41,275 | 37,049 | +11.4% |
| Total assets (¥ million) | 102,425 | 101,553 | +0.9% |
| Net assets (¥ million) | 81,517 | 79,829 | +2.1% |
| Equity ratio | 78.2% | 77.1% | +1.1 pt |
| FY3/2027 guidance — revenue (¥ million) | 35,810 | — | +2.5% |
| FY3/2027 guidance — operating profit (¥ million) | 1,790 | — | −12.3% |
| FY3/2027 guidance — ordinary profit (¥ million) | 2,650 | — | −6.5% |
| FY3/2027 guidance — net profit (¥ million) | 1,540 | — | −16.1% |
| FY3/2027 guidance — EPS (¥) | 58.49 | — | — |
| Annual dividend per share (¥) | 25.00 | 28.00 | −10.7% |
JapanStockPulse provides informational content only and does not constitute investment advice. Figures are taken from the company's published earnings short report and may be subject to subsequent revision.