A ¥599 million swing at the operating line on a ¥1,624 million revenue decline
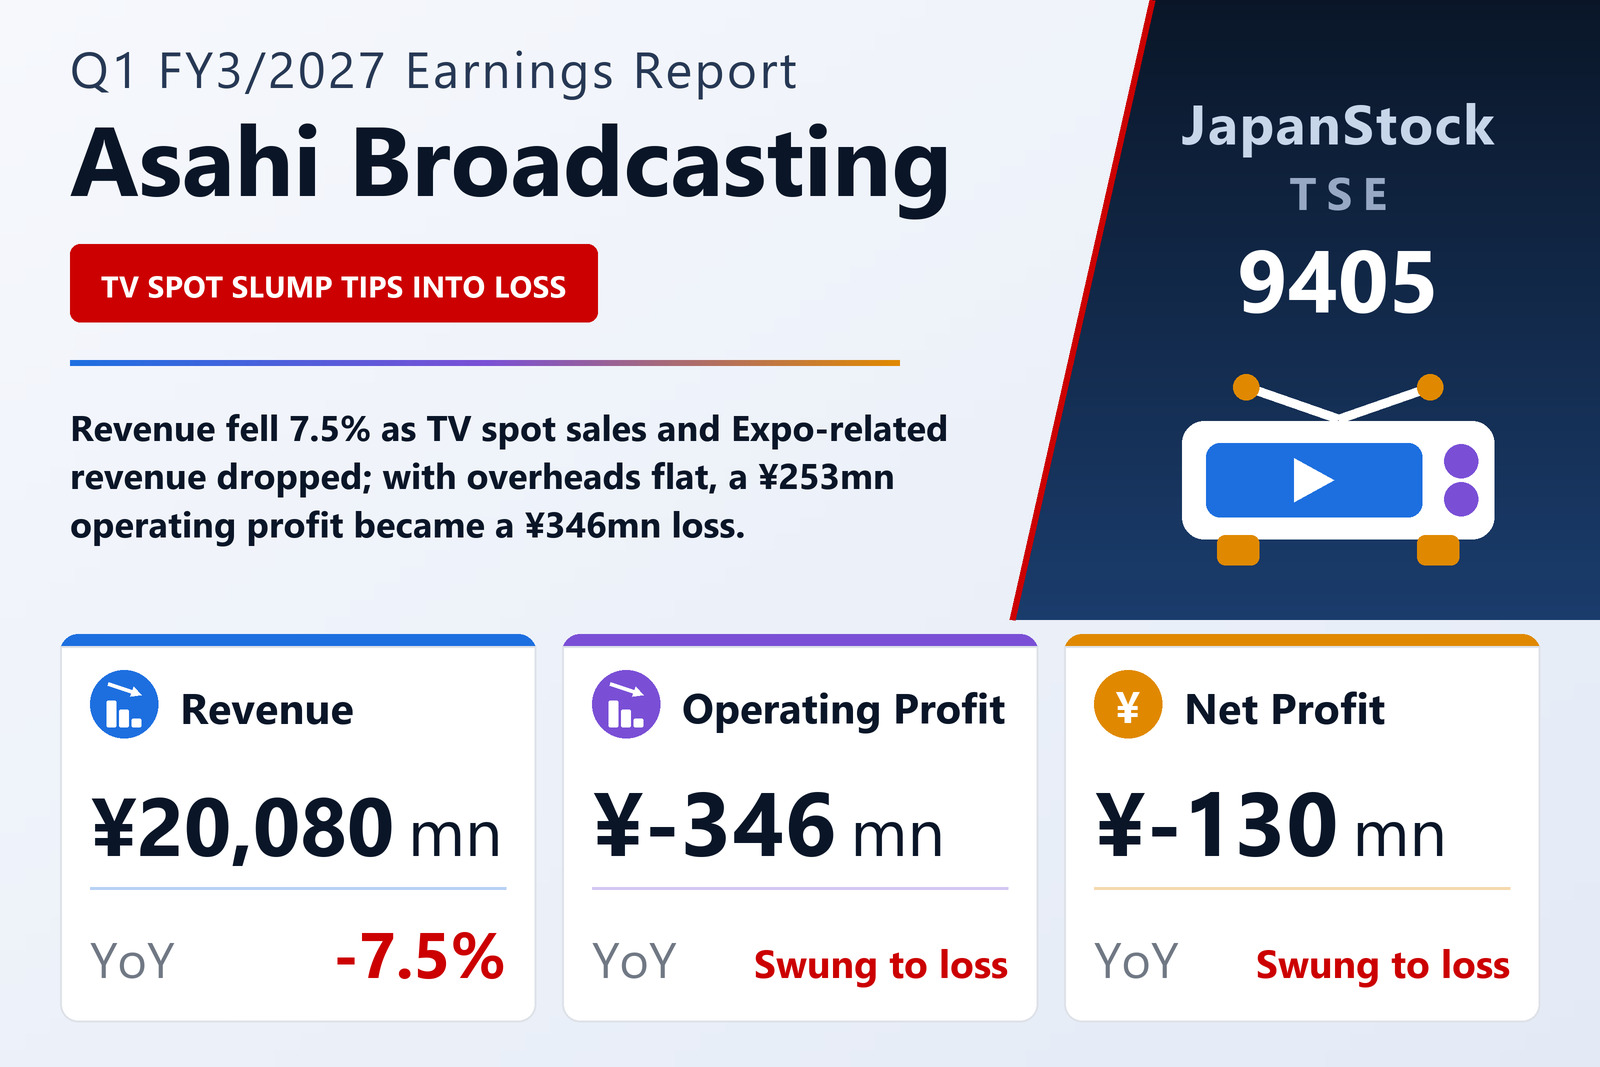
ASAHI BROADCASTING GROUP HOLDINGS CORP. (TSE: 9405), the holding company of a group organised into Broadcasting & Content and Lifestyle segments, published consolidated results for the first quarter of the fiscal year ending March 2027 — the three months from April 1 to June 30, 2026 — on August 5, 2026 under Japanese GAAP. Revenue fell 7.5% to ¥20,080 million. The company posted an operating loss of ¥346 million against an operating profit of ¥253 million a year earlier, an ordinary loss of ¥195 million against an ordinary profit of ¥355 million, and a loss attributable to owners of the parent of ¥130 million against a profit of ¥1,872 million. The loss per share was ¥3.13, against earnings of ¥44.86. The filing lists the company on the Tokyo Stock Exchange.
The arithmetic is short. Revenue fell by ¥1,624 million and cost of sales by ¥1,035 million (−7.0%) to ¥13,838 million, so cost of sales came down almost in proportion to revenue — but not quite. Gross profit fell ¥589 million (−8.6%) to ¥6,241 million and the gross margin slipped from 31.5% to 31.1%. Selling, general and administrative expenses did not flex at all: they rose by ¥10 million (+0.2%) to ¥6,588 million. The ¥589 million lost at the gross line plus the ¥10 million added in overheads is exactly the ¥599 million by which the operating result moved, from a ¥253 million profit to a ¥346 million loss. With those expenses running at roughly the size of gross profit, a 7.5% revenue decline was enough to push the operating line below zero.
Spot advertising and the Expo comparison drove the broadcasting loss
The filing names two causes at group level: lower television spot revenue, which it calls the mainstay, and the reversal of revenue earned a year earlier from the Osaka-Kansai Expo. Both land in Broadcasting & Content, which supplied 82.8% of group revenue. Its external revenue fell 8.8% to ¥16,626 million from ¥18,236 million. Network time revenue, video streaming revenue and revenue from secondary use of content all rose, the company says, but not enough to offset lower spot revenue and the loss of Expo-related event revenue. Operating expenses fell with revenue, yet the segment moved to an operating loss of ¥367 million from a ¥185 million profit, a deterioration of ¥552 million — nearly all of the group's ¥599 million.
Lifestyle was essentially flat, with revenue of ¥3,453 million against ¥3,468 million (−0.4%). The filing cites a decline in the housing business following the closure of housing exhibition sites and refers to the mail-order business in the same passage, though its wording does not separate how each moved. Operating expenses rose slightly and segment profit fell to ¥26 million from ¥71 million. Adjustments, covering intersegment eliminations and new-business development costs not allocated to either segment, were −¥5 million against −¥3 million. The company describes the Japanese economy as recovering moderately on better employment and income conditions and the effect of policy, with the outlook clouded by the Middle East situation and volatility in financial and capital markets.
Below the operating line, what is missing is last year's gain on fixed assets
Non-operating items were slightly better than a year earlier. Non-operating income rose to ¥230 million from ¥196 million, including interest income of ¥26 million against ¥7 million and dividend income of ¥134 million against ¥120 million, while non-operating expenses fell to ¥80 million from ¥93 million, including an equity-method investment loss of ¥40 million against ¥48 million. That left an ordinary loss of ¥195 million against a ¥355 million profit. Extraordinary gains were only ¥59 million, from the sale of investment securities, against ¥2,470 million a year earlier, when a ¥2,435 million gain on the sale of fixed assets and a ¥35 million gain on change in equity were booked.
The pre-tax result was therefore a loss of ¥136 million against a ¥2,826 million profit. Income taxes were a credit of ¥17 million against a charge of ¥942 million, leaving a net loss of ¥119 million; after ¥11 million attributable to non-controlling interests in both years, the loss attributable to owners of the parent was ¥130 million. The ¥2,002 million fall in that line is mostly the absence of last year's fixed-asset gain rather than trading. Comprehensive income was −¥622 million against ¥2,156 million, as other comprehensive income turned to −¥503 million from +¥272 million: the valuation difference on available-for-sale securities moved to −¥204 million from +¥470 million, and remeasurements of defined benefit plans were −¥293 million against −¥176 million.
Cash went to tax, debt repayment and the dividend
Total assets fell by ¥8,579 million to ¥125,938 million from March 31, 2026. Cash and deposits dropped to ¥16,885 million from ¥21,979 million, which the company attributes to payments of corporate and consumption taxes, repayment of the current portion of long-term borrowings and dividend payments; notes and accounts receivable and contract assets fell to ¥13,914 million from ¥16,581 million, and securities to ¥11,895 million from ¥13,201 million. Liabilities fell by ¥6,755 million to ¥43,496 million: the current portion of long-term borrowings to ¥805 million from ¥1,827 million, other accounts payable to ¥7,590 million from ¥9,758 million, and income taxes payable to ¥83 million from ¥2,346 million. Bonds were unchanged at ¥10,000 million.
Net assets fell by ¥1,824 million to ¥82,442 million. Retained earnings declined by ¥1,175 million to ¥58,695 million on the dividend payment and the quarter's loss, and the company bought back shares: treasury stock rose to ¥170 million from ¥24 million, and treasury shares to 221,045 from 43,345. Equity attributable to owners was ¥80,780 million against ¥82,604 million. Because total assets shrank faster than equity, the equity ratio rose to 64.1% from 61.4%. The company did not prepare a quarterly cash flow statement; depreciation was ¥893 million against ¥895 million, and goodwill amortisation ¥16 million against ¥27 million.
Guidance held; the dividend forecast is below last year's payout
The company says first-quarter results were within its assumptions and left its full-year FY3/2027 guidance unchanged: revenue of ¥92,300 million (−3.9%), operating profit of ¥4,000 million (−16.0%), ordinary profit of ¥4,100 million (−7.2%) and profit attributable to owners of the parent of ¥2,700 million (−39.4%), for earnings per share of ¥64.83. The first quarter delivered 21.8% of guided revenue while losing money at the operating line, so the full-year target implies operating profit of about ¥4,346 million over the remaining nine months. The tanshin does not describe how earnings are expected to be spread across the year.
The dividend forecast was also left unchanged. After an annual ¥33.00 for FY3/2026 — ¥8.00 at the interim and ¥25.00 at the year-end — the company forecasts ¥8.00 at the interim and ¥12.00 at the year-end, for ¥20.00, down 39.4% and about 30.8% of guided earnings per share. The tanshin does not give a reason for the lower year-end figure.
| Metric | Q1 FY3/2027 | Q1 FY3/2026 | Change |
|---|---|---|---|
| Revenue (¥ million) | 20,080 | 21,704 | −7.5% |
| Gross profit (¥ million) | 6,241 | 6,830 | −8.6% |
| Gross margin | 31.1% | 31.5% | −0.4 pt |
| SG&A expenses (¥ million) | 6,588 | 6,577 | +0.2% |
| Operating profit (¥ million) | −346 | 253 | profit to loss |
| Ordinary profit (¥ million) | −195 | 355 | profit to loss |
| Extraordinary gains (¥ million) | 59 | 2,470 | −97.6% |
| Pre-tax profit (¥ million) | −136 | 2,826 | profit to loss |
| Net profit attrib. to owners of parent (¥ million) | −130 | 1,872 | profit to loss |
| Comprehensive income (¥ million) | −622 | 2,156 | profit to loss |
| EPS (¥) | −3.13 | 44.86 | profit to loss |
| Broadcasting & Content — revenue (¥ million) | 16,626 | 18,236 | −8.8% |
| Broadcasting & Content — segment profit (¥ million) | −367 | 185 | profit to loss |
| Lifestyle — revenue (¥ million) | 3,453 | 3,468 | −0.4% |
| Lifestyle — segment profit (¥ million) | 26 | 71 | −63.4% |
| Total assets (¥ million) | 125,938 | 134,518 | −6.4% |
| Net assets (¥ million) | 82,442 | 84,266 | −2.2% |
| Equity ratio | 64.1% | 61.4% | +2.7 pt |
| FY3/2027 guidance — revenue (¥ million) | 92,300 | — | −3.9% |
| FY3/2027 guidance — operating profit (¥ million) | 4,000 | — | −16.0% |
| FY3/2027 guidance — ordinary profit (¥ million) | 4,100 | — | −7.2% |
| FY3/2027 guidance — net profit (¥ million) | 2,700 | — | −39.4% |
| FY3/2027 guidance — EPS (¥) | 64.83 | — | — |
| Annual dividend per share (¥) | 20.00 | 33.00 | −39.4% |
JapanStockPulse provides informational content only and does not constitute investment advice. Figures are taken from the company's published earnings short report and may be subject to subsequent revision.