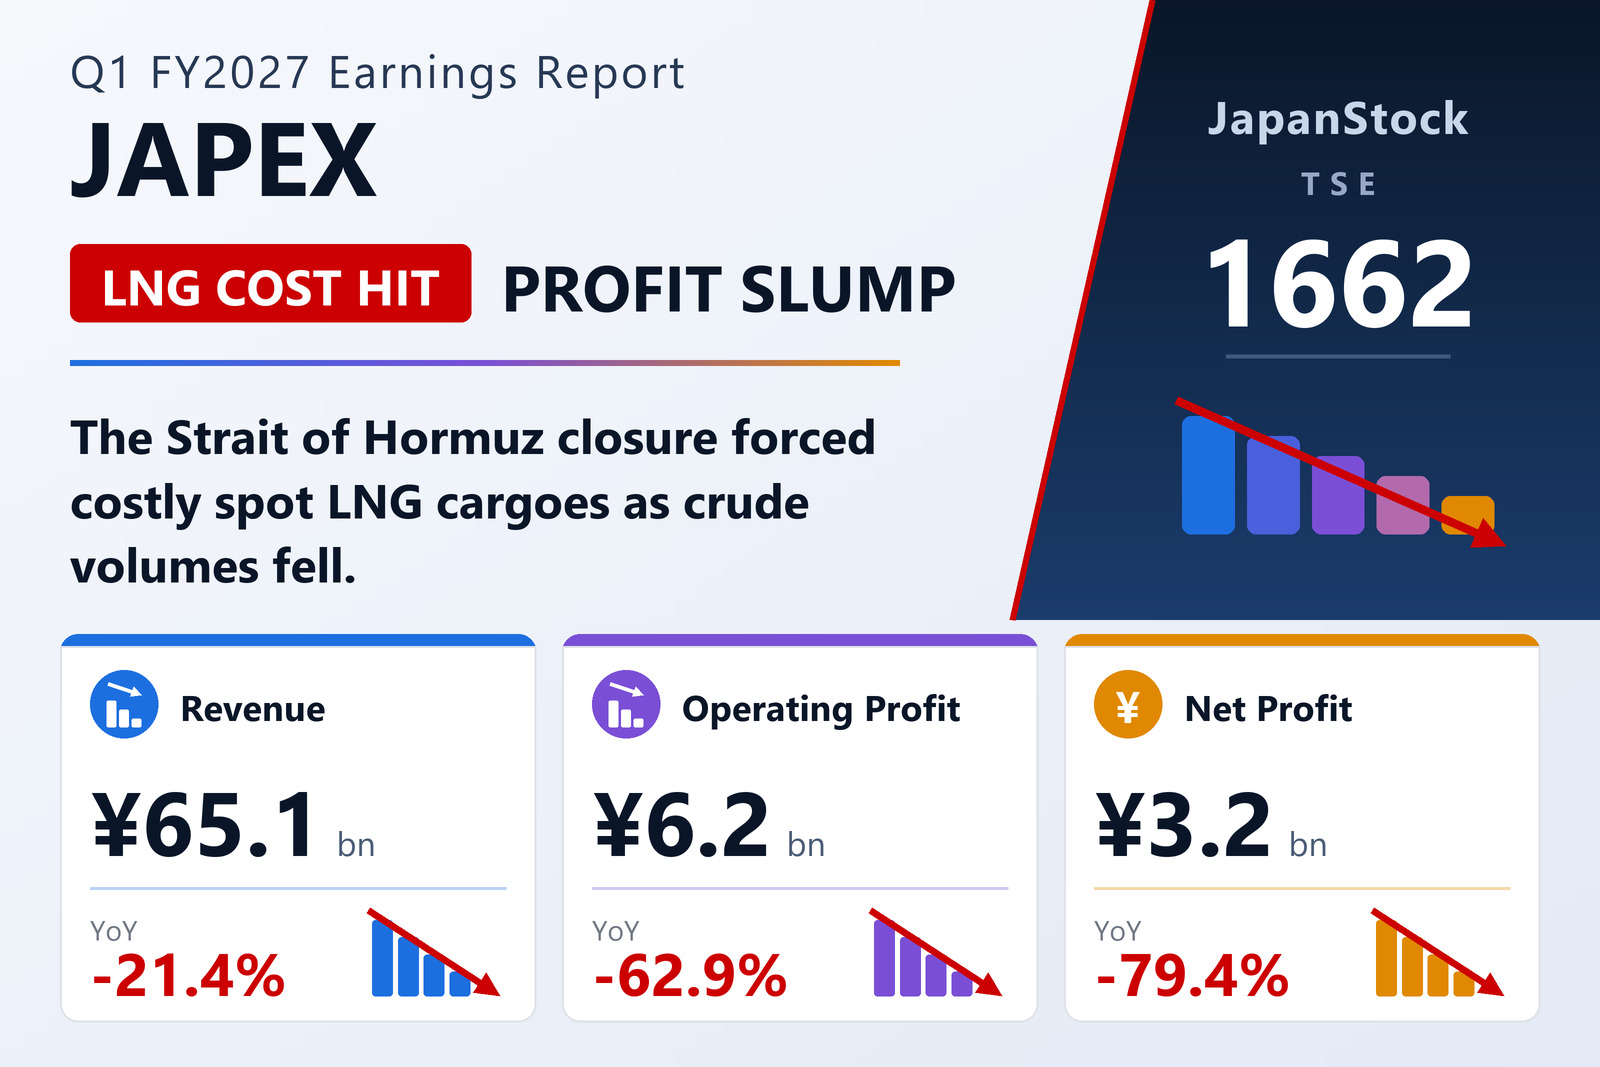
Japan Petroleum Exploration Co., Ltd. (TSE: 1662), the Tokyo-based oil and gas producer known as JAPEX and led by President and CEO Michio Yamashita, reported consolidated results for the first quarter of the fiscal year ending March 2027 — the three months from April 1 to June 30, 2026 — under Japanese accounting standards. Net sales fell 21.4% to ¥65,114 million, operating profit dropped 62.9% to ¥6,202 million, ordinary profit fell 72.3% to ¥5,773 million and net profit attributable to owners of the parent declined 79.4% to ¥3,240 million. Basic earnings per share came to ¥12.66, against ¥61.41 a year earlier. The figures have not been reviewed by an accounting auditor.
Hormuz closure forces spot LNG buying as crude volumes slide
Two forces drove the top line down. The first was volume: overseas crude oil production fell 29.9% to 1,888 thousand barrels from 2,694 thousand, and overseas crude sales volume dropped to 1,856 thousand barrels from 2,049 thousand, worth ¥17,788 million against ¥21,504 million a year earlier. Domestic crude production was essentially flat at 350 thousand barrels versus 351 thousand, but electricity output almost halved, falling 46.9% to 324 million kWh from 610 million. The second and more unusual force was procurement cost. With the Strait of Hormuz closed, JAPEX could not take delivery of cargoes it had planned to source from inside the Persian Gulf and had to buy replacement LNG on the spot market from other producing regions, pushing its LNG procurement costs sharply higher. LNG sales volume itself rose to 38,183 tonnes from 35,693 tonnes, so the damage came through the cost line rather than through demand: cost of sales fell only to ¥45,510 million from ¥57,522 million, well short of the fall in revenue, and gross profit dropped 22.6% to ¥19,603 million from ¥25,321 million.
Exploration spending jumps fifteenfold and profit falls away below the operating line
Below gross profit the picture worsened. Exploration expenses jumped to ¥3,929 million from just ¥251 million a year earlier — an increase of ¥3,677 million, or roughly fifteen times the prior-year charge — and selling, general and administrative expenses rose 13.2% to ¥9,472 million from ¥8,369 million. Together those two lines account for most of the ¥10,497 million fall in operating profit, and the operating margin narrowed to 9.5% from 20.2%. Ordinary profit fell further still, by ¥15,037 million or 72.3%, because the non-operating account swung against the company on both sides: total non-operating income halved to ¥2,107 million from ¥5,002 million as equity-method investment income collapsed to ¥307 million from ¥1,766 million and a ¥1,783 million derivative valuation gain in the prior year did not repeat, while total non-operating expenses rose to ¥2,536 million from ¥892 million on a ¥1,302 million derivative valuation loss against ¥37 million previously. Foreign-exchange gains of ¥921 million (¥318 million a year earlier) provided a partial offset. Extraordinary items were immaterial, so pre-tax profit matched ordinary profit at ¥5,773 million; income taxes of ¥1,722 million and ¥810 million attributable to non-controlling interests left ¥3,240 million for owners of the parent. Comprehensive income swung to −¥23,753 million from +¥3,627 million, a movement of roughly ¥27.4 billion, driven by fair-value declines on investment securities and deferred hedge losses rather than by operations.
North America overtakes Japan as the group's largest profit centre
By business line, exploration and production (E&P) sales fell 11.7% to ¥24,126 million on lower crude oil sales volume, and infrastructure and utility sales fell 12.5% to ¥34,799 million on lower natural gas and electricity volumes — domestic natural gas sales volume slipped to 6,658 million cubic feet from 7,104 million. The steepest decline was in the "other" business, which covers contract drilling and geological surveys, LPG, heavy oil and other petroleum products and outsourced services: sales fell 60.8% to ¥6,188 million, a drop of ¥9,580 million, as petroleum products and merchandise collapsed to ¥1,706 million from ¥14,270 million even though contract work rose to ¥4,097 million from ¥1,046 million.
The geographic split is where the quarter's most striking shift appears. Japan generated external sales of ¥46,655 million and segment profit of just ¥2,329 million, against ¥59,441 million and ¥9,420 million a year earlier. North America held up far better, with sales of ¥15,633 million and segment profit of ¥6,548 million versus ¥16,303 million and ¥6,864 million — making North America the group's single largest profit contributor, at nearly three times Japan's contribution. Europe earned ¥1,340 million on sales of ¥2,794 million, down from ¥3,104 million on ¥6,249 million, and the Middle East swung to a segment loss of ¥109 million on almost no sales (¥31 million) from a ¥621 million profit on ¥849 million. Reportable segment profit totalled ¥10,109 million against ¥20,011 million; after unallocated corporate costs of ¥3,906 million (¥3,312 million a year earlier), operating profit was ¥6,202 million.
Cash builds and long-term borrowings return, but net assets fall on securities marks
Total assets were broadly stable at ¥859,805 million, down ¥2,664 million from ¥862,470 million at March 31, 2026, but the composition changed considerably. Current assets rose ¥37,262 million, with cash and deposits climbing to ¥96,178 million from ¥54,259 million as guarantee deposits were released, while non-current assets fell ¥39,926 million — almost entirely because investment securities were marked down to ¥240,866 million from ¥274,024 million. Total liabilities rose ¥32,697 million to ¥236,270 million: current liabilities fell ¥11,631 million as commercial paper was repaid and accrued expenses rose, but non-current liabilities increased ¥44,329 million, with long-term borrowings of ¥57,756 million appearing where there had been none and deferred tax liabilities falling to ¥47,015 million from ¥60,292 million. Net assets fell ¥35,361 million to ¥623,535 million, reflecting the drop in valuation difference on available-for-sale securities to ¥69,222 million from ¥94,349 million and in deferred hedge gains to ¥10,941 million from ¥19,666 million. Shareholders' equity ended at ¥591,424 million against ¥627,537 million and the equity ratio eased to 68.8% from 72.8% — still a conservatively financed balance sheet. Shares issued stood at 257,000,380 including 1,001,089 treasury shares, with 255,999,378 shares averaged over the quarter.
Full-year guidance revised and the dividend cut to ¥45
JAPEX revised its FY3/2027 forecasts on August 6, 2026, replacing the plan issued on May 13, 2026; a separate "Notice of Revision to Earnings Forecast" was published the same day. The company now guides to net sales of ¥314,000 million, down 7.7%, operating profit of ¥46,000 million, up 18.2%, ordinary profit of ¥46,000 million, down 25.3%, and net profit attributable to owners of the parent of ¥65,000 million, up 21.7%, with earnings per share of ¥253.91. Two features of that guidance deserve attention. First, guided net profit exceeds guided ordinary profit, which implies material extraordinary gains are expected later in the year rather than an improvement in the underlying business. Second, the first quarter's ¥6,202 million of operating profit represents only 13.5% of the ¥46,000 million full-year target, leaving a substantial second-half weighting to deliver. On shareholder returns, the FY3/2026 annual dividend was ¥65.00 (¥20.00 interim plus ¥45.00 year-end); for FY3/2027 the company forecasts ¥45.00, split evenly as ¥22.50 at the interim and ¥22.50 at the year-end — a 30.8% reduction from the prior year, and unchanged from the previously announced forecast.
| Metric | Q1 FY3/2027 | Q1 FY3/2026 | YoY |
|---|---|---|---|
| Net sales (¥ million) | 65,114 | 82,844 | −21.4% |
| Gross profit (¥ million) | 19,603 | 25,321 | −22.6% |
| Operating profit (¥ million) | 6,202 | 16,699 | −62.9% |
| Ordinary profit (¥ million) | 5,773 | 20,810 | −72.3% |
| Net profit attrib. to owners (¥ million) | 3,240 | 15,714 | −79.4% |
| Basic EPS (¥) | 12.66 | 61.41 | −79.4% |
| Comprehensive income (¥ million) | −23,753 | 3,627 | n.m. |
| Operating margin (%) | 9.5 | 20.2 | −10.7pt |
| Equity ratio (%) | 68.8 | 72.8 | −4.0pt |
| E&P sales (¥ million) | 24,126 | 27,309 | −11.7% |
| Infrastructure & Utility sales (¥ million) | 34,799 | 39,764 | −12.5% |
| FY3/2027 net sales guidance (¥ million) | 314,000 | — | −7.7% |
| FY3/2027 operating profit guidance (¥ million) | 46,000 | — | +18.2% |
| FY3/2027 ordinary profit guidance (¥ million) | 46,000 | — | −25.3% |
| FY3/2027 net profit guidance (¥ million) | 65,000 | — | +21.7% |
| FY3/2027 EPS guidance (¥) | 253.91 | — | — |
| FY3/2027 dividend forecast (¥) | 45.00 | 65.00 | −30.8% |
JapanStockPulse provides informational content only and does not constitute investment advice. Figures are taken from the company's published earnings short report and may be subject to subsequent revision.