A decline the operating businesses did not produce
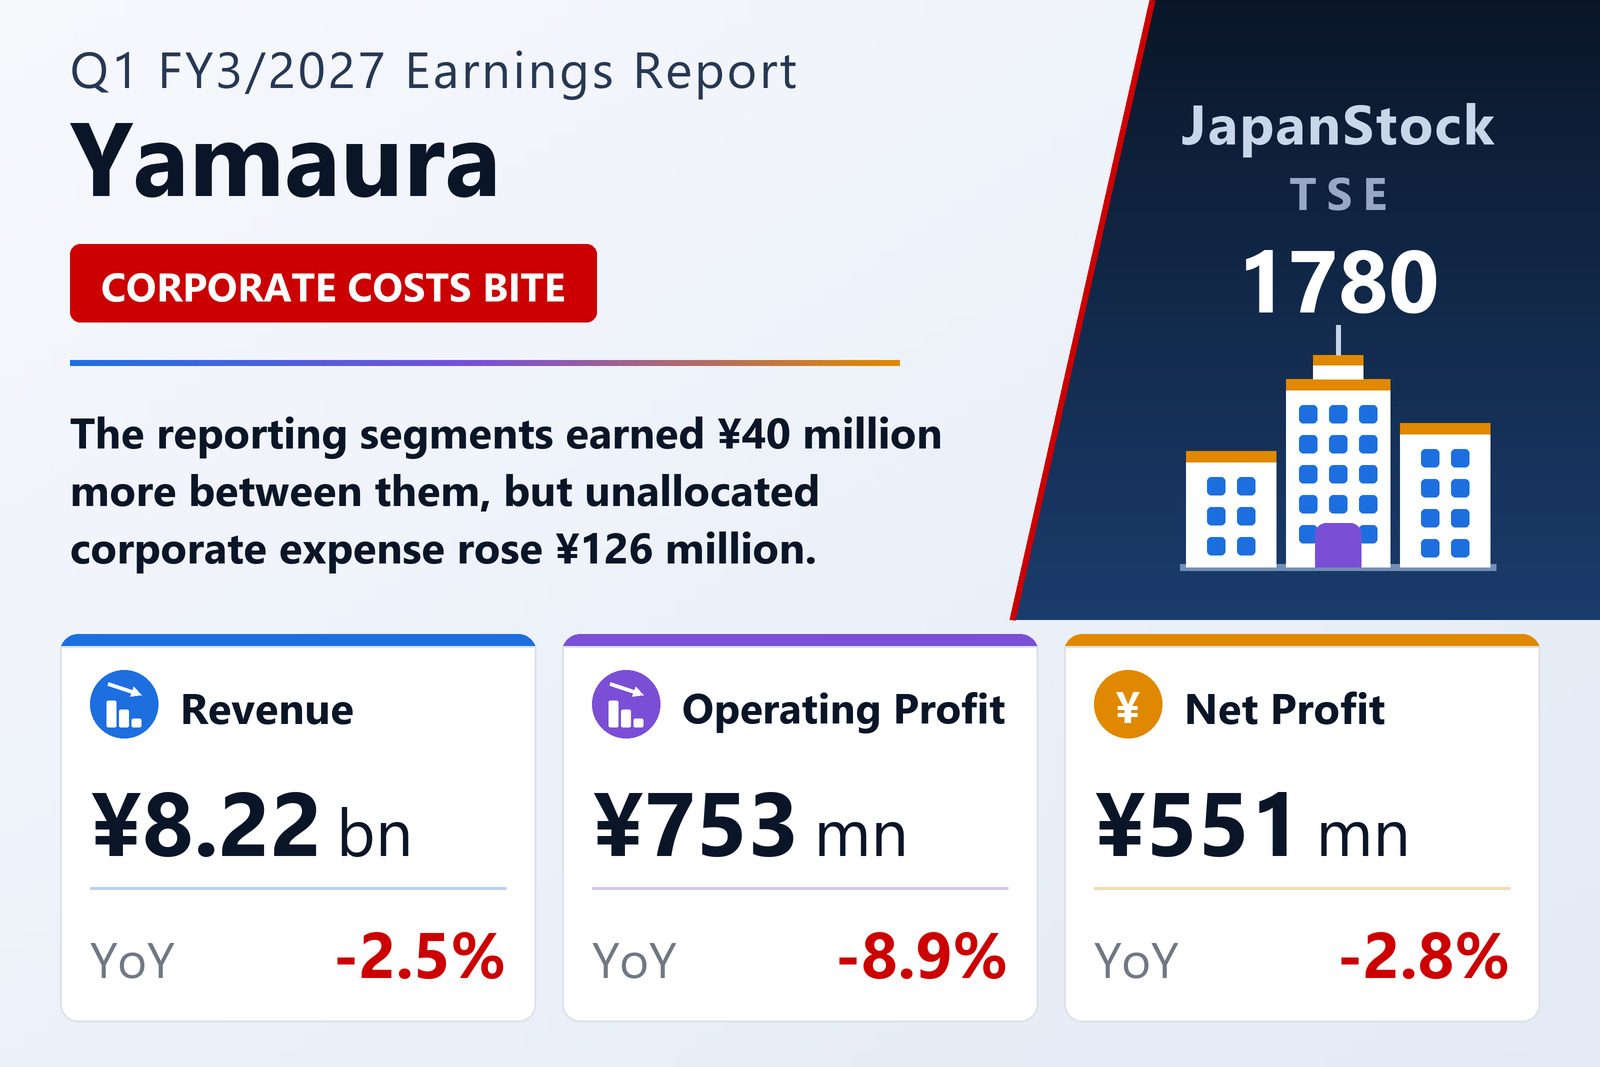
Yamaura Corporation (TSE: 1780), the Nagano-based group whose activities span general construction, plant and equipment engineering, and property development, published consolidated results for the first quarter of FY3/2027 — April 1 to June 30, 2026 — under Japanese GAAP on August 6, 2026. Revenue fell 2.5% to ¥8,216 million from ¥8,431 million, a decline of ¥214 million. Operating profit fell 8.9% to ¥753 million, ordinary profit 6.9% to ¥812 million, and net profit attributable to owners of parent 2.8% to ¥551 million. Every headline line moved down, and the profit lines moved down faster than revenue.
The segment note tells a different story. Yamaura's three reportable segments — Construction, Engineering, and Development and other — earned ¥1,147.4 million between them, up 3.6% from ¥1,107.8 million. What converts a ¥39.6 million improvement into a ¥73.4 million decline is the adjustment line beneath it. Unallocated corporate expense — general and administrative cost the company does not charge down to the segments — rose to ¥406.5 million from ¥280.0 million, an increase of ¥126.5 million, or 45.2%. A ¥13.4 million swing in inter-segment eliminations, to plus ¥12.4 million from minus ¥1.0 million, gave some of that back, leaving the total adjustment ¥113.0 million heavier at minus ¥394.1 million against minus ¥281.0 million.
The arithmetic closes exactly: ¥39.6 million of segment improvement less ¥113.0 million of extra adjustment is the ¥73.4 million by which operating profit fell. Read that way, the quarter is a head-office cost event rather than an operating deterioration — and the distinction matters, because the two carry very different implications for the rest of the year.
Three segments, three different quarters
Construction, which is 90% of the group's external revenue, delivered ¥7,374.5 million, down 1.9% from ¥7,520.7 million — but segment profit rose 2.3% to ¥1,095.1 million from ¥1,070.5 million. Its margin on total segment revenue widened to 14.9% from 14.2%. The core business earned more money on less work, which in a contractor is the outcome that matters: revenue in construction is a function of when jobs complete, whereas margin is a function of how they were priced and executed.
Engineering — the plant and equipment business — produced external revenue of ¥525.6 million, down 0.8% and essentially flat, but segment profit of ¥49.4 million against ¥10.6 million, a 368.2% increase that lifted its margin to 9.4% from 2.0%. The percentage flatters a very small base; the absolute figure is ¥38.9 million of extra profit. That is worth noting precisely because it is nearly the whole of the ¥39.6 million the three segments added between them.
Development and other went the other way, and hard. External revenue fell 16.9% to ¥316.7 million from ¥381.2 million, and segment profit fell 89.3% to ¥2.9 million from ¥26.7 million — a margin of 0.9% against 7.0%. Within that, revenue recognised at a point in time, which is essentially property handed over to buyers, fell 18.2% to ¥297.8 million from ¥364.2 million, while rental income rose 8.2% to ¥25.0 million from ¥23.1 million. Profit fell by ¥23.9 million on a ¥64.5 million revenue decline, so this is not purely a volume effect.
That sits awkwardly beside management's commentary, which says condominium sales in the Tokyo metropolitan area are running broadly ahead of the medium-term plan. The two are reconcilable: condominium revenue is recognised at a point in time on handover, so a strong sales pace and a weak quarter of recognised profit can coexist comfortably in a business whose deliveries cluster. It does mean, though, that the development segment's contribution to the year is almost entirely still ahead of it.
Gross margin widened; the cost sat below it
The most counter-intuitive number in the filing is the gross margin. Consolidated gross profit rose 2.2% to ¥1,524.0 million from ¥1,490.6 million on 2.5% lower revenue, lifting the gross margin to 18.5% from 17.7%. Completed-construction gross profit rose 2.9% to ¥1,452.2 million on construction revenue of ¥7,900.0 million against ¥8,050.3 million, a margin of 18.4% against 17.5%. Even the development business improved its gross margin, to 22.7% from 20.8%, though its gross profit fell 9.3% to ¥71.8 million on the lower volume.
Everything therefore happened between gross profit and operating profit. Selling, general and administrative expenses rose 16.1% to ¥770.8 million from ¥663.8 million, an increase of ¥106.9 million set against a ¥33.5 million gross-profit gain — and the difference of ¥73.4 million is, once again, precisely the operating-profit decline. Depreciation, including amortisation of intangibles, rose to ¥91.0 million from ¥78.8 million, so ¥12.2 million of the SG&A increase is accounted for there.
One detail is worth holding onto. Total SG&A rose ¥106.9 million while unallocated corporate expense in the segment note rose ¥126.5 million. Corporate expense is a subset of SG&A, so the implication is that SG&A charged down to the operating segments actually fell by roughly ¥19.6 million. The increase is concentrated at the head office, not spread across the businesses.
Below the operating line: interest income and a change of tax method
Non-operating income rose 28.4% to ¥62.8 million from ¥49.0 million. Interest income was six times the prior year at ¥13.5 million against ¥2.2 million; dividends received were roughly flat at ¥40.3 million against ¥39.5 million; and insurance proceeds of ¥7.4 million appeared where the prior-year quarter had none, offset by other income falling to ¥1.3 million from ¥6.9 million. Non-operating expenses were ¥3.4 million against ¥2.3 million, with interest paid down to ¥1.0 million from ¥1.8 million. The net below-the-line contribution improved to ¥59.4 million from ¥46.6 million, which is why ordinary profit fell only 6.9% where operating profit fell 8.9%.
Net profit then fell less again, 2.8%, and the reason is tax. The charge was ¥179.1 million of current tax plus ¥82.1 million of deferred tax, ¥261.2 million on ¥812.7 million of pre-tax profit — an effective rate of 32.1% — against ¥306.1 million on ¥873.4 million, or 35.1%, a year earlier. That is ¥44.9 million less tax on ¥60.7 million less pre-tax profit. Earnings per share came to ¥29.13 from ¥29.97, on a weighted average of 18,932,460 shares against 18,927,227; there are no potential dilutive shares.
The rate move is not accidental. Yamaura discloses that from this quarter the parent company changed its method of calculating tax expense from the simplified method to the principle method, in order to compute it more rationally. Consolidated subsidiaries remain on the simplified method, and their deferred tax adjustment is presented inside "income taxes — current". The company states the effect of the change is immaterial, but it is the reason a deferred tax line of ¥82.1 million appears at all this year where the prior-year quarter showed none.
Comprehensive income was the one headline figure to rise, up 17.5% to ¥741.3 million from ¥630.7 million. Other comprehensive income of ¥189.8 million against ¥63.5 million comprised ¥199.4 million of valuation gains on available-for-sale securities, against ¥68.3 million, less a ¥9.6 million retirement-benefit adjustment. That is the investment portfolio marking up on market prices, and it should be kept separate from the ¥551.5 million the business itself earned.
Orders fell 6.7% — and rotated out of building into engineering
Orders received on a parent-company basis were ¥8,586 million, down 6.7% from ¥9,204 million. The base matters: the prior-year first quarter had itself grown 62.9%, so the comparison is against an unusually strong period rather than a normal one. What the supplementary order table shows underneath that headline is a wholesale change of mix.
The construction segment took ¥6,145 million of orders, down 26.8%, and its share of the total collapsed to 71.6% from 91.3%. Building work drove that: ¥5,645 million against ¥8,153 million, down 30.8%, with public-sector building down 84.5% to ¥137 million from ¥889 million and private building down 24.2% to ¥5,507 million. Civil engineering moved the opposite way, up 102.5% to ¥500 million, and within it public civil-engineering orders rose 459.8% to ¥442 million from ¥79 million while private civil orders fell 65.6% to ¥57 million.
The offset came from Engineering, where orders more than tripled — ¥2,348 million against ¥763 million, up 207.8% — lifting its share of the total to 27.4% from 8.3%. Private-sector engineering orders rose 200.0% to ¥2,244 million and public-sector engineering orders rose 595.7% to ¥104 million. Development and other took ¥92 million against ¥40 million. Across the whole book, public-sector orders fell 30.4% to ¥684 million and private-sector orders fell 4.5% to ¥7,809 million, so private work now represents 90.9% of the parent's order intake against 88.9%.
The company's own narrative attributes the quarter's order activity to increased private building work from manufacturers — food-related equipment and precision instruments among them — and transport operators, a large order for hydroelectric-power-related equipment, increased public building orders, and river-improvement and road works taken on the back of the national resilience plan. The order table supports two of those clearly: the ¥1,585 million surge in engineering orders is consistent with a large hydroelectric project, and the 459.8% jump in public civil-engineering orders is consistent with river and road work. It does not support the claim about public building orders, which fell 84.5% in the parent-only quarterly table. The qualitative commentary is not period-matched to that table, and readers should treat the numbers as the harder evidence.
Equity fell because of buybacks, not because of losses
Total assets stood at ¥36,288 million at June 30, 2026, up 0.8% from ¥36,007 million at March 31. Liabilities rose to ¥10,497 million from ¥9,827 million. Net assets fell 1.5% to ¥25,791 million from ¥26,181 million, and the equity ratio slipped to 71.1% from 72.7% — still an unusually well-capitalised balance sheet for a contractor. There are no non-controlling interests, so shareholders' equity equals net assets. Cash and deposits rose ¥739 million to ¥9,579 million.
The reason equity fell in a profitable quarter is on the shareholders' equity lines. Retained earnings rose ¥224.7 million to ¥21,020.5 million: ¥551.5 million of quarterly profit less a residual ¥326.9 million, which is the FY3/2026 year-end dividend paid during the quarter. Against that, treasury stock deepened by ¥804.2 million to minus ¥1,984.2 million, and the treasury share count rose to 2,744,477 from 2,176,287 — 568,190 shares bought back in three months. The buyback is roughly two and a half times the quarter's retained profit, which is what pulls net assets down.
After the balance-sheet date, on July 3, 2026, Yamaura cancelled 600,000 treasury shares, equal to 3.26% of the shares outstanding excluding treasury before cancellation, under a board resolution of May 13, 2026. Shares issued were 21,103,514 at June 30. Because the buying was spread through the quarter and the cancellation fell after it, the weighted average share count used for EPS barely moved; the effect on share count shows up in the second quarter.
Guidance untouched, dividend up 20% anyway
Yamaura left its FY3/2027 forecast exactly as published on May 13, 2026. First-half guidance is revenue of ¥18,200 million, down 5.0%, operating profit of ¥1,634 million, down 19.8%, ordinary profit of ¥1,838 million, down 20.7%, and net profit attributable to owners of parent of ¥1,286 million, down 18.1%, for EPS of ¥70.00. Full-year guidance is revenue of ¥41,126 million, up 1.5%, operating profit of ¥3,694 million, down 13.3%, ordinary profit of ¥3,947 million, down 13.5%, and net profit of ¥2,714 million, down 14.2%, for EPS of ¥143.41.
Against those numbers the quarter is on track. Q1 delivered 20.0% of full-year guided revenue, 20.4% of operating profit, 20.6% of ordinary profit and 20.3% of net profit — a shade ahead of a straight quarter on every profit line. Measured against the first half alone it delivered 45.1% of guided revenue and 46.1% of guided operating profit.
The shape of the year is the more interesting feature. Full-year revenue is guided up 1.5% while the first half is guided down 5.0%, which implies second-half revenue of ¥22,926 million against the first half's ¥18,200 million — 26.0% more in the back six months. Operating profit implies ¥2,060 million in the second half against ¥1,634 million, 26.1% more. Yamaura is a contractor with completions weighted toward the fiscal year-end and a development business that books condominium revenue on handover, so a back-loaded year is normal rather than heroic; the point is that nothing in Q1 has disturbed that assumption, and equally that nothing in Q1 has yet demonstrated it.
The dividend moves in the opposite direction to the earnings. FY3/2026 paid ¥13.00 at the interim and ¥17.00 at the year-end, ¥30.00 in total. For FY3/2027 the company forecasts ¥17.00 interim and ¥19.00 year-end, ¥36.00 — up 20.0%, with the interim alone up 30.8% — and left that forecast unchanged in the same document that reports every profit line lower and guides full-year net profit down 14.2%. On guided EPS of ¥143.41 the payout ratio is 25.1%, so the increase is being funded out of a payout ratio that remains modest rather than out of a stretched one. Set beside ¥804 million of stock bought in three months and 600,000 shares cancelled in July, the capital-return posture is distinctly more expansive than the profit guidance it sits next to.
| Metric | Q1 FY3/2027 | Q1 FY3/2026 | Change |
|---|---|---|---|
| Revenue (¥ million) | 8,216 | 8,431 | −2.5% |
| Gross profit (¥ million) | 1,524 | 1,490 | +2.2% |
| Gross margin | 18.5% | 17.7% | +0.9 pt |
| SG&A expenses (¥ million) | 770 | 663 | +16.1% |
| Operating profit (¥ million) | 753 | 826 | −8.9% |
| Operating margin | 9.2% | 9.8% | −0.6 pt |
| Ordinary profit (¥ million) | 812 | 873 | −6.9% |
| Net profit attrib. to owners of parent (¥ million) | 551 | 567 | −2.8% |
| Comprehensive income (¥ million) | 741 | 630 | +17.5% |
| EPS (¥) | 29.13 | 29.97 | −2.8% |
| Segment revenue — Construction (¥ million) | 7,374.5 | 7,520.7 | −1.9% |
| Segment revenue — Engineering (¥ million) | 525.6 | 529.6 | −0.8% |
| Segment revenue — Development and other (¥ million) | 316.7 | 381.2 | −16.9% |
| Segment profit — Construction (¥ million) | 1,095.1 | 1,070.5 | +2.3% |
| Segment profit — Engineering (¥ million) | 49.4 | 10.6 | +368.2% |
| Segment profit — Development and other (¥ million) | 2.9 | 26.7 | −89.3% |
| Reportable segment profit, total (¥ million) | 1,147.4 | 1,107.8 | +3.6% |
| Unallocated corporate expense (¥ million) | −406.5 | −280.0 | +45.2% |
| Orders received, parent basis (¥ million) | 8,586 | 9,204 | −6.7% |
| Total assets (¥ million, vs Mar 31, 2026) | 36,288 | 36,007 | +0.8% |
| Net assets (¥ million, vs Mar 31, 2026) | 25,791 | 26,180 | −1.5% |
| Equity ratio (vs Mar 31, 2026) | 71.1% | 72.7% | −1.6 pt |
| Dividend per share (¥, FY3/2027 forecast vs FY3/2026 actual) | 36.00 | 30.00 | +20.0% |
| Metric | H1 FY3/2027 | Full year FY3/2027 | Q1 as % of full year |
|---|---|---|---|
| Revenue (¥ million) | 18,200 | 41,126 | 20.0% |
| Operating profit (¥ million) | 1,634 | 3,694 | 20.4% |
| Ordinary profit (¥ million) | 1,838 | 3,947 | 20.6% |
| Net profit attrib. to owners of parent (¥ million) | 1,286 | 2,714 | 20.3% |
| EPS (¥) | 70.00 | 143.41 | 20.3% |
JapanStockPulse provides informational content only and does not constitute investment advice. Figures are taken from the company's published earnings short report and may be subject to subsequent revision.