Revenue up 21.9%, and then three widening gaps
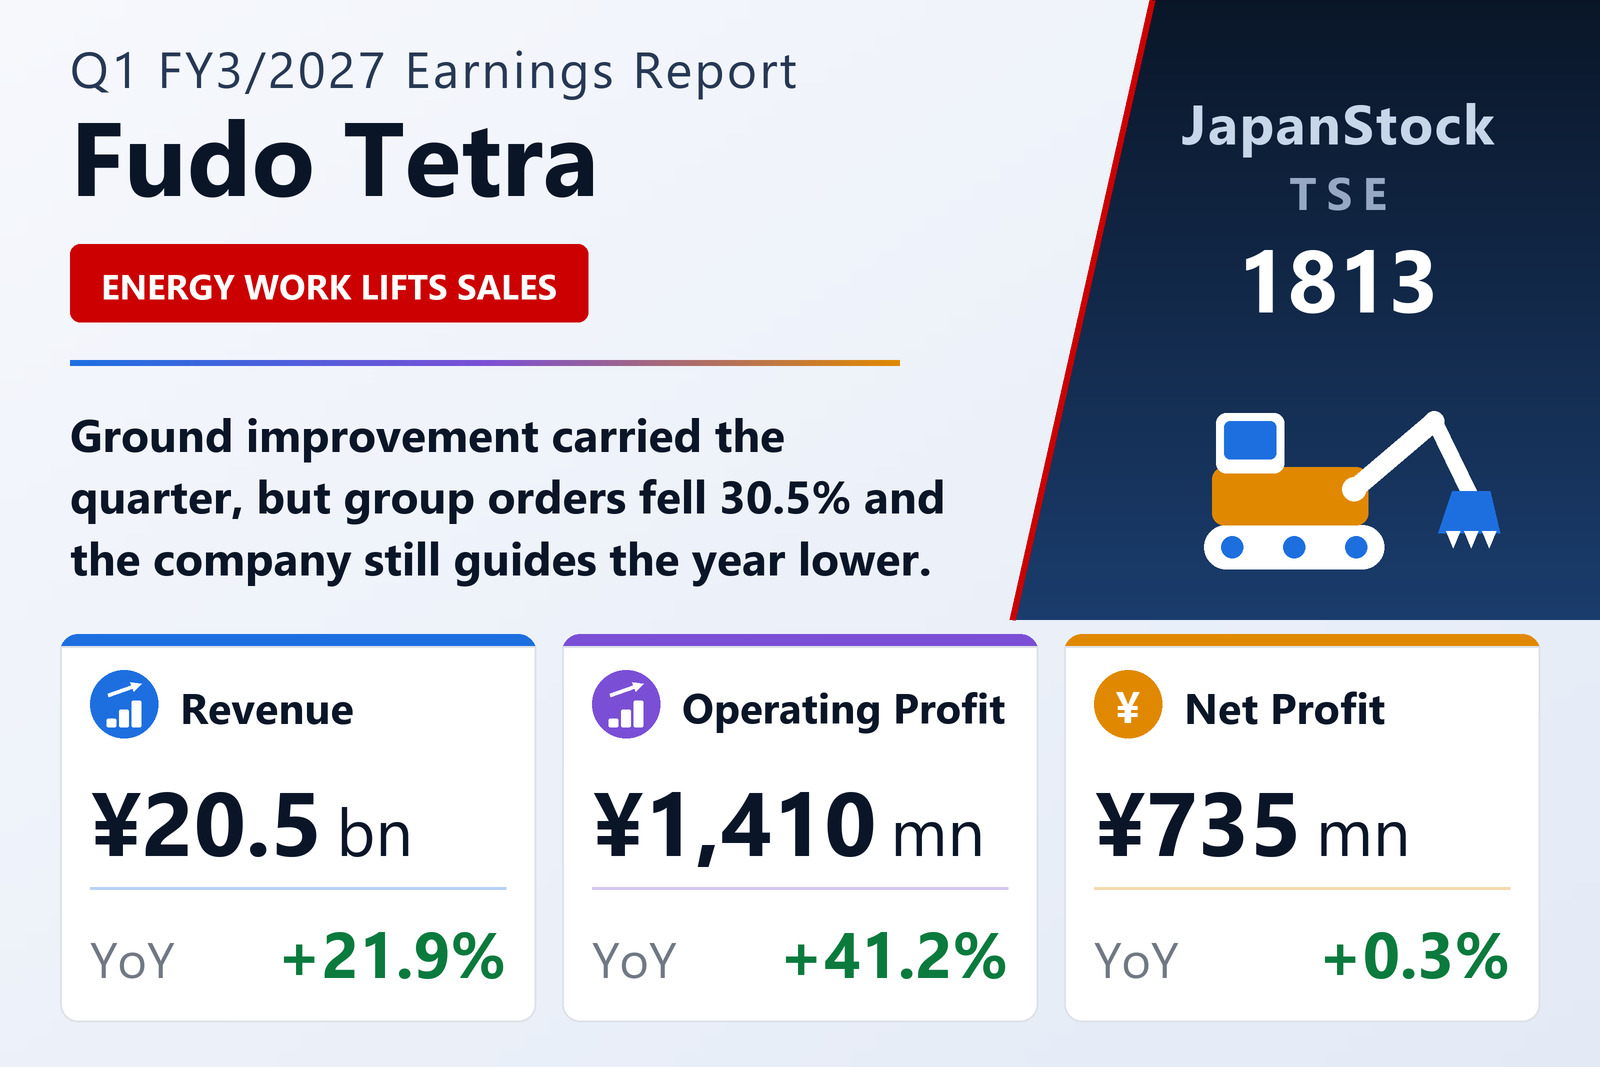
Fudo Tetra Corporation (TSE: 1813), the ground-improvement and civil-engineering contractor, published consolidated results for the first quarter of FY3/2027 — April 1 to June 30, 2026 — under Japanese GAAP on August 6, 2026. Revenue rose 21.9% to ¥20,531 million from ¥16,848 million, on top of a 29.2% gain in the same quarter a year earlier. Below that line, each successive profit measure grew more slowly than the one above it: operating profit up 41.2% to ¥1,410 million, ordinary profit up only 12.1% to ¥1,260 million, and net profit attributable to owners of parent up 0.3% to ¥735 million. Each step has a distinct cause, and they do not all point the same way.
The clearest sign that something changed below the operating line is the order of the two middle profit lines themselves. A year ago ordinary profit of ¥1,124 million sat above operating profit of ¥999 million — non-operating items were a net contribution. This quarter ordinary profit of ¥1,260 million sits ¥150 million below operating profit of ¥1,410 million. The net non-operating position swung from about +¥125 million to about −¥151 million, a deterioration of roughly ¥276 million, and that single swing is why the profit lines diverge.
The backdrop the company describes is a familiar split. Public construction investment is expected to hold firm on the government's national-resilience programme and the effect of supplementary budgets, while private construction investment continues to recover on improving corporate earnings and spending on labour saving, decarbonisation and digitalisation. On the supply side, rising labour costs from worker shortages and higher construction-material and crude-oil prices continue to squeeze profitability — a pressure that shows up clearly in the numbers below.
The operating gain came from overheads, not from margin
Operating profit grew almost twice as fast as revenue, but not because the work itself became more profitable. It became less profitable. Gross profit rose 14.6% to ¥3,656 million from ¥3,190 million — well behind revenue's 21.9% — so the gross margin narrowed to 17.8% from 18.9%, giving back 1.1 percentage points.
The construction business is where that happened. Completed-construction revenue rose 22.4% to ¥20,077 million while completed-construction cost rose 24.0% to ¥16,567 million, leaving construction gross profit up only 15.2% and its margin down to 17.5% from 18.6%. The much smaller ancillary business — ¥454 million of revenue against ¥442 million — contributed ¥146 million of gross profit against ¥143 million, and changes nothing.
What produced the operating-profit jump was cost discipline above the line. Selling, general and administrative expenses rose just 2.5% to ¥2,245 million from ¥2,191 million — an increase of ¥54 million set against a ¥466 million gross-profit gain. Practically all of the incremental gross profit therefore reached the operating line: ¥466 million less ¥54 million is ¥412 million, against an actual operating-profit increase of ¥411 million. The operating margin reached 6.9% from 5.9%. On a business that added ¥3,683 million of revenue while adding ¥54 million of overhead, that is operating leverage, not pricing power.
Below the operating line: a ¥223 million equity-method loss and a heavier tax bill
The non-operating section is where the quarter turns. Non-operating income fell to ¥127 million from ¥183 million, and non-operating expenses rose to ¥278 million from ¥58 million — close to a fivefold increase. One item accounts for almost all of it. The group booked a ¥223 million loss from equity-method investments this quarter, where a year earlier it recorded a ¥28 million equity-method gain. That line alone swung ¥251 million, or 91% of the ¥276 million total deterioration. The filing does not name the affiliate or explain the loss.
The rest is small by comparison. Dividends received fell to ¥100 million from ¥139 million. Interest income was unchanged at ¥5 million. Interest expense rose to ¥43 million from ¥27 million. The remaining non-operating expenses — commissions, guarantee fees, bad-debt provisioning and other items — fell to roughly ¥12 million from roughly ¥31 million, a small offset in the right direction.
The segment reconciliation confirms the same item from the other side, and it is worth reading. Fudo Tetra's internal segment-profit measure includes equity-method results; statutory operating profit does not, so the difference is reconciled in an adjustment line. That adjustment swung from −¥165 million a year ago to +¥78 million this quarter, a ¥243 million improvement, of which ¥251 million is the equity-method item. Read on the company's own internal measure, the reporting segments plus "Other" earned ¥1,333 million against ¥1,164 million — up 14.5%, far closer to ordinary profit's 12.1% than to operating profit's 41.2%. The equity-method loss is stripped out of operating profit and then charged below it; that is why the two lines tell different stories about the same quarter.
Below ordinary profit, the story changes a third time. Extraordinary items were negligible and, if anything, helpful: a ¥5 million gain on the sale of fixed assets against ¥7 million a year earlier, and essentially no extraordinary losses against ¥10 million. Pre-tax profit therefore rose 12.8% to ¥1,265 million from ¥1,121 million — slightly better than ordinary profit.
Tax then took the increase away. The total charge was ¥515 million against ¥395 million, an effective rate of 40.7% against 35.2%. The ¥120 million increase in tax consumed most of the ¥144 million pre-tax gain. Both years' charges are dominated by deferred tax — ¥432 million of the ¥515 million this quarter, ¥367 million of ¥395 million last year — so the movement is a timing effect rather than cash out the door. Quarterly net profit came to ¥750 million from ¥727 million, and profit attributable to non-controlling interests then swung to +¥15 million from −¥5 million, taking a further ¥20 million out of the parent's share. Net profit attributable to owners of parent: ¥735 million against ¥732 million. Earnings per share were ¥48.50 against ¥48.42, on a weighted average of 15,149,609 shares against 15,123,435.
Comprehensive income was the one line that moved wide of the others, at ¥851 million against ¥728 million, up 16.9%. Other comprehensive income of ¥101 million against ¥1 million did that, and the swing sits in the securities portfolio: a ¥46 million valuation gain on available-for-sale securities where the prior year carried a ¥69 million mark-down. Currency translation added ¥45 million and retirement-benefit adjustments ¥10 million. That is a market-price effect on holdings, not operating performance.
Ground improvement carries the group; civil engineering's margin nearly disappears
Ground Improvement — soil-stabilisation and compaction work built around the company's proprietary methods — produced revenue of ¥11,534 million, up 25.4%, and segment profit of ¥1,442 million, up 42.5%. Its segment margin widened to 12.5% from 11.0%. Both carried-over and newly won work progressed well, and volume did the rest. On its own it earned more than the combined total reported for the three segments.
Civil Engineering produced revenue of ¥8,881 million, up 18.2%, and segment profit of ¥45 million, down 84.2%. The margin fell to 0.5% from 3.8%. The company's explanation is specific and, on its face, temporary: the share of low-margin work within completed-construction revenue rose. The revenue itself came from the opening backlog progressing smoothly, so this is a mix effect on work already booked rather than a demand problem — but it is also the mechanism by which the labour and materials inflation described above reaches the profit line.
Block — precast concrete units for coastal and river protection — produced revenue of ¥253 million, down 25.3%, on a smaller carried-over balance of merchandise sales, and a segment loss of ¥155 million against a ¥148 million loss. The company says profitability itself was maintained and that the wider loss simply follows the revenue decline. At ¥253 million of revenue the segment is 1.2% of the group, and at that scale its loss is close to structural.
Orders down 30.5%, backlog down 17%
Orders received in the quarter fell 30.5% to ¥22,694 million from ¥32,636 million. Because revenue rose at the same time, the book-to-bill ratio fell to 1.11 from 1.94. The backlog carried into the next period fell 17.3% to ¥75,231 million from ¥90,976 million, and it reconciles exactly: an opening backlog of ¥73,068 million (down 2.8%) plus ¥22,694 million of new orders less ¥20,531 million of revenue.
The decline is concentrated in Civil Engineering, where orders fell 57.0% to ¥3,817 million from ¥8,878 million and the closing backlog fell to ¥47,596 million from ¥58,109 million. At the quarter's revenue rate that is 5.4 quarters of cover, down from 7.7. Public-works order timing is lumpy at quarterly frequency, so one quarter is not a trend — but the backlog is the cumulative record, and it has fallen ¥10,513 million year on year.
Ground Improvement orders fell 21.1% to ¥18,361 million, which the company characterises as remaining at a high level, citing a rich pipeline of projects using its proprietary methods including energy-related work. Both readings can be true at once: ¥18,361 million is 4.8 times Civil Engineering's intake and, at the quarter's revenue rate, still 1.6 quarters of new work booked in three months. Its closing backlog fell to ¥26,837 million from ¥32,621 million, or 2.3 quarters of cover from 3.5.
Block was the only segment to grow orders, up 5.7% to ¥662 million, lifting its closing backlog to ¥834 million from ¥596 million — the smallest numbers on the page, and the only ones moving up.
A balance sheet ¥8.8 billion smaller, and short-term debt halved
Total assets fell ¥8,754 million, or 12.3%, to ¥62,414 million at June 30 from ¥71,168 million at March 31. The company attributes the decline mainly to contract assets and to notes and accounts receivable from completed construction, and the balance sheet bears that out: contract assets fell ¥3,646 million to ¥23,979 million, notes and accounts receivable fell ¥1,545 million to ¥3,329 million, electronically recorded receivables fell ¥578 million to ¥1,305 million, and cash and deposits fell ¥1,268 million to ¥9,165 million. Those four lines account for ¥7,037 million of the ¥8,754 million decline.
That is a collection cycle, and the proceeds went to debt. Liabilities fell ¥7,846 million, or 24.0%, to ¥24,781 million, and short-term borrowings alone fell ¥7,500 million — exactly halved, to ¥7,500 million from ¥15,000 million. Income taxes payable fell to ¥90 million from ¥1,610 million; contract liabilities rose to ¥3,801 million from ¥1,208 million.
Net assets fell ¥908 million to ¥37,633 million: the ¥735 million of net profit was more than offset by the dividend paid, with retained earnings down ¥1,025 million to ¥17,954 million. Shareholders' equity — the numerator of the equity ratio — fell ¥921 million to ¥37,156 million.
The result is a six-point jump in the equity ratio, to 59.5% from 53.5%. That is arithmetic rather than a capital event: equity fell 2.4% while total assets fell 12.3%. Fudo Tetra does not prepare a cash flow statement for the first quarter, but it discloses depreciation of ¥724 million against ¥848 million and goodwill amortisation of ¥7 million against ¥19 million.
Guidance unchanged, a 20th-anniversary interim dividend — and profits guided lower from here
Full-year guidance issued on May 11, 2026 is unchanged: revenue of ¥81,000 million, down 0.9%; operating profit of ¥4,800 million, down 18.9%; ordinary profit of ¥4,900 million, down 20.0%; and net profit attributable to owners of parent of ¥3,200 million, down 28.3%, for EPS of ¥211.23.
The tension with the quarter just reported is plain: every profit line rose in the first quarter, and every profit line is guided down for the year. Q1 delivered 25.3% of the revenue target and 29.4% of the operating-profit target, along with 25.7% of ordinary profit and 23.0% of net profit. Holding guidance therefore requires the remaining three quarters to produce ¥3,390 million of operating profit — an average of ¥1,130 million a quarter against the ¥1,410 million just delivered. For context, the ¥999 million earned in Q1 last year was roughly 17% of the full year that this guidance implies.
One detail inside the guidance points the other way. Guided ordinary profit of ¥4,900 million sits above guided operating profit of ¥4,800 million, so the company still assumes ¥100 million of net non-operating income for the full year. Q1 delivered −¥151 million. That implies about ¥251 million of net non-operating income across the remaining nine months — which is to say the company is not assuming the equity-method loss repeats.
The dividend is unchanged in total and changed in shape. FY3/2026 paid nothing at the interim and ¥115.00 at the year-end. For FY3/2027 the company plans ¥30.00 at the second-quarter end and ¥85.00 at the year-end, again ¥115.00 in total — but the ¥30.00 interim payment is new, and the filing states it is planned as a commemorative dividend marking the 20th anniversary of the merger that formed the company. Shareholders receive the same annual amount; roughly a quarter of it simply arrives six months earlier. Against guided EPS of ¥211.23 the payout ratio is 54.4%.
| Metric | Q1 FY3/2027 | Q1 FY3/2026 | Change |
|---|---|---|---|
| Revenue (¥ million) | 20,531 | 16,848 | +21.9% |
| Gross profit (¥ million) | 3,656 | 3,190 | +14.6% |
| Gross margin | 17.8% | 18.9% | −1.1 pt |
| SG&A expenses (¥ million) | 2,245 | 2,191 | +2.5% |
| Operating profit (¥ million) | 1,410 | 999 | +41.2% |
| Operating margin | 6.9% | 5.9% | +0.9 pt |
| Net non-operating items (¥ million) | −151 | +125 | −276 |
| Ordinary profit (¥ million) | 1,260 | 1,124 | +12.1% |
| Pre-tax profit (¥ million) | 1,265 | 1,121 | +12.8% |
| Income taxes (¥ million) | 515 | 395 | +30.4% |
| Effective tax rate | 40.7% | 35.2% | +5.5 pt |
| Net profit attrib. to owners of parent (¥ million) | 735 | 732 | +0.3% |
| Comprehensive income (¥ million) | 851 | 728 | +16.9% |
| EPS (¥) | 48.50 | 48.42 | +0.2% |
| Orders received (¥ million) | 22,694 | 32,636 | −30.5% |
| Order backlog, period start (¥ million) | 73,068 | 75,188 | −2.8% |
| Order backlog, period end (¥ million) | 75,231 | 90,976 | −17.3% |
| Civil Engineering revenue (¥ million) | 8,881 | 7,517 | +18.2% |
| Civil Engineering segment profit (¥ million) | 45 | 287 | −84.2% |
| Ground Improvement revenue (¥ million) | 11,534 | 9,196 | +25.4% |
| Ground Improvement segment profit (¥ million) | 1,442 | 1,012 | +42.5% |
| Block revenue (¥ million) | 253 | 339 | −25.3% |
| Block segment loss (¥ million) | −155 | −148 | −7 |
| Total assets (¥ million) | 62,414 | 71,168 | −12.3% |
| Net assets (¥ million) | 37,633 | 38,541 | −2.4% |
| Equity ratio | 59.5% | 53.5% | +6.0 pt |
| Short-term borrowings (¥ million) | 7,500 | 15,000 | −50.0% |
| FY3/2027 guidance — revenue (¥ million) | 81,000 | — | −0.9% |
| FY3/2027 guidance — operating profit (¥ million) | 4,800 | — | −18.9% |
| FY3/2027 guidance — ordinary profit (¥ million) | 4,900 | — | −20.0% |
| FY3/2027 guidance — net profit (¥ million) | 3,200 | — | −28.3% |
| FY3/2027 guidance — EPS (¥) | 211.23 | — | — |
| Dividend per share, full year (¥) | 115.00 | 115.00 | unchanged |
JapanStockPulse provides informational content only and does not constitute investment advice. Figures are taken from the company's published earnings short report and may be subject to subsequent revision.