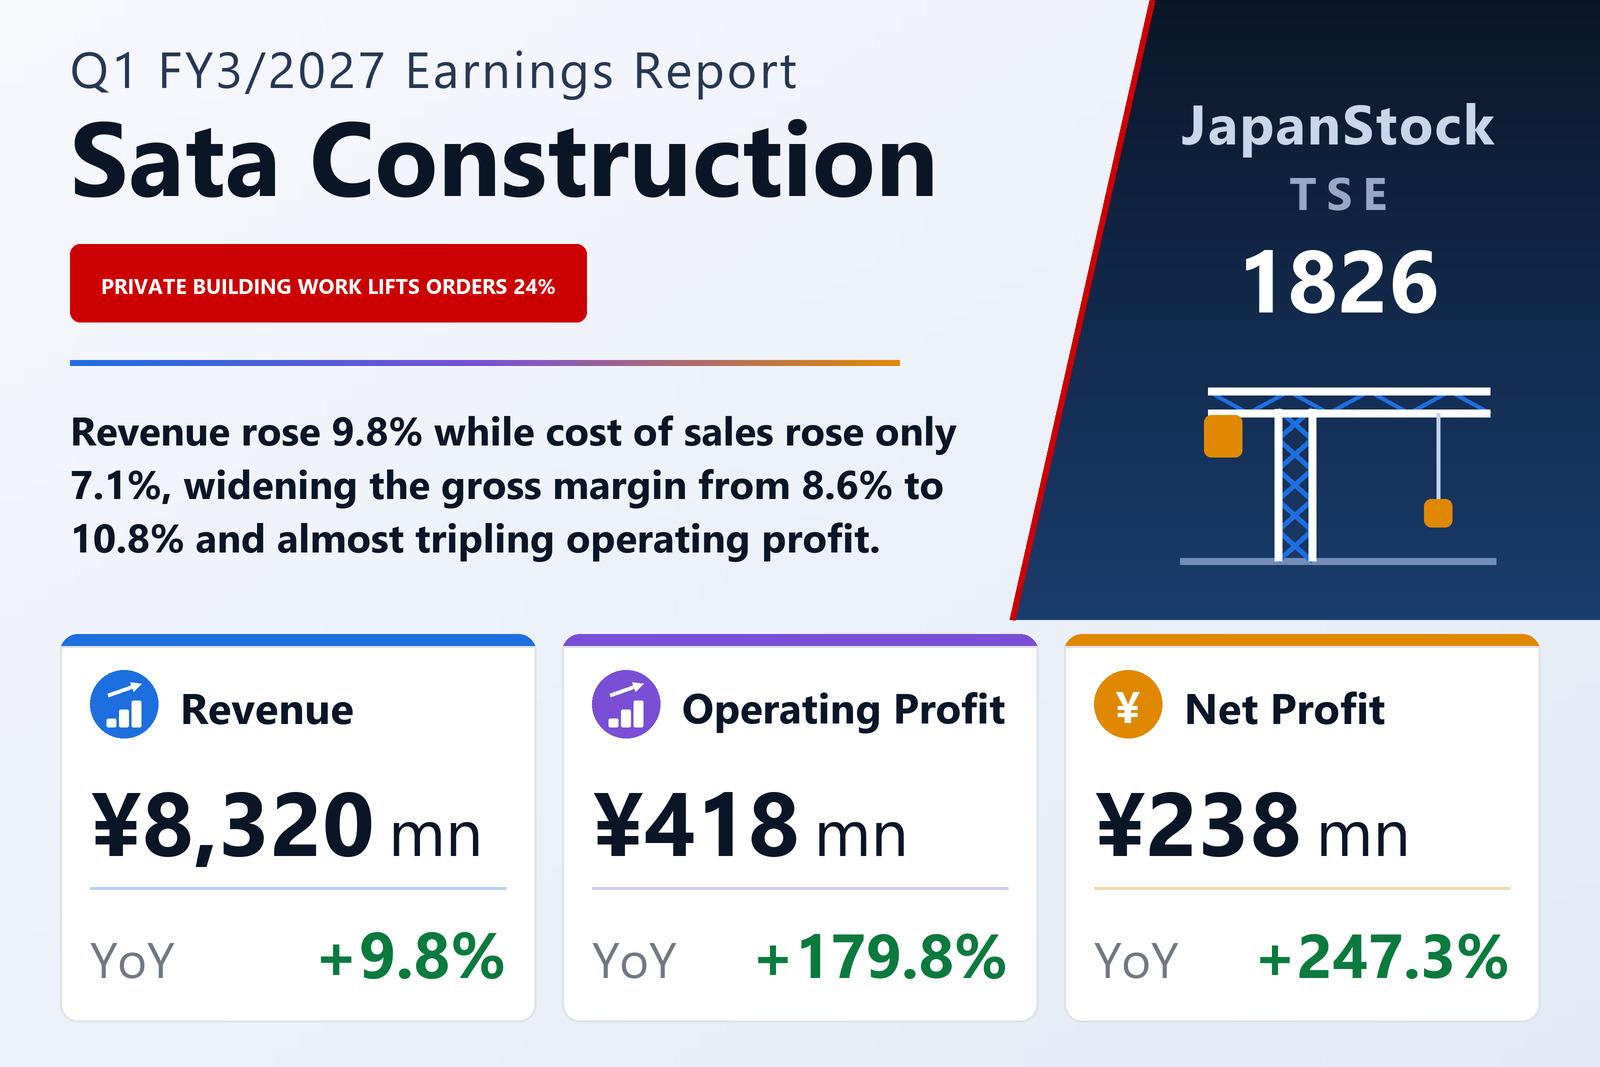
A 2.2-point gross-margin gain turned 9.8% revenue growth into a 180% profit jump
Sata Construction Co., Ltd. (TSE: 1826), the Japanese general contractor whose work divides between civil-engineering and building-construction contracts, published consolidated first-quarter results for the three months from April 1 to June 30, 2026 on August 6, 2026 under Japanese GAAP. Revenue rose 9.8% to ¥8,320 million, operating profit 179.8% to ¥418 million, ordinary profit 180.8% to ¥420 million and profit attributable to owners of the parent 247.3% to ¥238 million, for earnings of ¥19.84 per share against ¥4.50. The company is listed on the Tokyo Stock Exchange.
The whole of that operating gain sits in two lines. Cost of sales rose 7.1% to ¥7,421 million against revenue growth of 9.8% — a gap of about 2.7 percentage points on a cost base of more than ¥7,000 million. Gross profit therefore rose 38.5% to ¥899 million, close to four times the rate of revenue, and the gross margin widened from 8.6% to 10.8%. Selling, general and administrative expenses did not merely grow more slowly than revenue; they fell 3.6%, to ¥481 million. Both movements reached the operating line intact, taking the operating margin from 2.0% to 5.0%. The company attributes the gross-margin improvement to the higher revenue, to better profitability on large projects and to progress in negotiations to pass on costs.
Orders up 24% and backlog up 19% — but the growth is all private building work
Orders received rose 24.0% to ¥11,655 million, an increase of ¥2,259 million, and the order backlog rose 19.1% to ¥37,744 million, an increase of ¥6,046 million. Within construction contracts, civil-engineering orders rose 70.6% to ¥2,183 million and building-construction orders 16.4% to ¥9,331 million, while the ancillary businesses took ¥140 million of orders, up 44.5%. The backlog splits very differently from the orders, however. Building-construction backlog rose 33.7% to ¥28,448 million while civil-engineering backlog fell 10.8% to ¥9,296 million, so building work now accounts for 75.4% of the backlog against 67.1% a year earlier. The group's forward workload has become markedly more dependent on private building projects.
The same shift shows in the quarter's revenue by client type. Revenue from public-sector clients fell from ¥2,897 million to ¥1,956 million, a decline of 32.5%, while revenue from private-sector clients rose from ¥4,679 million to ¥6,364 million, a gain of 36.0%. Private work therefore supplied ¥1,685 million of additional revenue while public work gave back ¥941 million, netting out to the group's increase of ¥744 million. The reason the filing gives is the same for both the revenue and the order growth: an increase in private building-construction work.
All three segments improved, and the smallest crossed into profit
Segment profit at this company is gross profit, reconciled to the consolidated income statement. Building Construction, the largest segment, produced revenue of ¥5,763 million, up 10.7%, and segment gross profit of ¥606 million, up 33.4%, lifting its gross margin from 8.7% to 10.5%. Civil Engineering grew more slowly on revenue, ¥2,416 million, up 6.2%, but improved its margin further, with segment gross profit of ¥288 million, up 40.5%, taking that segment's gross margin from 9.0% to 11.9%. Ancillary Businesses, at ¥140 million of revenue, up 44.5%, turned a ¥14 million gross loss into a ¥6 million gross profit. The three sum to ¥902 million against consolidated gross profit of ¥899 million, the difference being the elimination of intersegment transactions — an adjustment of −¥2 million this year against +¥3 million last year.
The filing warns that the first quarter is the small one
Sata Construction states plainly in the filing that its construction business carries a seasonal pattern: because contracts concentrate completion and handover in the fourth quarter, revenue recognised there is markedly larger than in the first three quarters. The figures bear that out against the company's own full-year expectation. Revenue of ¥8,320 million is 22.1% of the ¥37,600 million guided for the year, and operating profit of ¥418 million is 27.9% of the ¥1,500 million guided. The 179.8% operating gain is also measured against a weak base: the filing's own prior-year line shows the June 2025 quarter with revenue down 10.0% and operating profit down 26.0%. A quarter that is both seasonally small and compared with a depressed one carries less information about the year than its percentage suggests.
A ¥160 million deferred-tax charge held back net profit
Below the operating line the movements are small. Non-operating income was ¥8 million against ¥4 million and non-operating expenses ¥6 million against ¥4 million, of which interest expense was ¥5 million against ¥4 million, so ordinary profit rose 180.8% to ¥420 million. There were no extraordinary items at all this year, against a ¥4 million gain on the sale of fixed assets and a negligible disposal loss a year earlier, leaving pre-tax profit of ¥420 million against ¥153 million. Income taxes took ¥181 million against ¥84 million, an effective rate of 43.1%, and the filing names the reason: ¥160 million of deferred income-tax charge arising from the reversal of deferred tax assets. Deferred tax assets within investments and other assets duly fell from ¥268 million to ¥105 million. Net profit attributable to owners of the parent still rose 247.3% to ¥238 million, and comprehensive income 187.5% to ¥245 million.
Earnings per share rose further than profit did — 340.9%, from ¥4.50 to ¥19.84 — because the average number of shares outstanding fell 21.3%, from 15,297,833 to 12,045,608. Issued shares were unchanged at 13,386,233 and treasury shares rose by 820 to 1,341,051, so the decline in the average count reflects share movements over the preceding year rather than anything done in this quarter.
Assets fell 12% as the year-end receivables were collected
The balance sheet compares June 30, 2026 with March 31, 2026, and it shrank. Total assets fell 12.2% to ¥22,251 million from ¥25,352 million, as completed-construction receivables fell ¥4,524 million to ¥6,478 million and cash and deposits rose ¥1,592 million to ¥10,313 million — the ordinary pattern for a contractor whose completions cluster in the fourth quarter and whose cash arrives a quarter later. Liabilities fell 18.7% to ¥11,377 million, with construction payables down ¥1,806 million to ¥4,073 million and short-term borrowings down ¥1,016 million to ¥290 million. Net assets fell 4.2% to ¥10,873 million, chiefly on ¥722 million of dividends paid. Because assets fell faster than equity, the equity ratio rose 4.1 points to 48.9% — an improvement produced by a shrinking balance sheet rather than by retained earnings, which in fact fell from ¥8,283 million to ¥7,799 million. No quarterly cash flow statement was prepared; depreciation was ¥44 million against ¥48 million.
Guidance and dividend both left exactly where they were
The company left untouched the full-year guidance it published on May 11, 2026: revenue of ¥37,600 million (+2.3%), operating profit of ¥1,500 million (−15.3%), ordinary profit of ¥1,410 million (−17.9%) and profit attributable to owners of ¥910 million (−5.6%), for earnings of ¥75.54 per share. Its stated reason for not revising is that conditions from here are unclear. Taken at face value, that guidance implies ¥1,082 million of operating profit across the remaining nine months against the ¥418 million already booked, and a full year in which operating profit falls 15.3% even though the first quarter almost tripled it. The filing offers no reconciliation between the two, and the seasonality note is the only context it gives.
The dividend forecast was likewise unrevised. Sata Construction expects to pay ¥60.00 per share at the year-end and ¥60.00 for the year, with no interim dividend, the same as the ¥60.00 paid for the year to March 2026 — a payout of about 79% of the ¥75.54 of guided earnings per share. The quarter itself carried the cash cost of the previous year-end dividend, ¥722 million. The filing records no change in the scope of consolidation, no change of accounting policy or estimate and no restatement, and the quarterly statements were not reviewed by an accounting auditor. The company prepared no supplementary explanatory material and held no results briefing.
| Metric | Q1 FY3/2027 | Q1 FY3/2026 | Change |
|---|---|---|---|
| Revenue (¥ million) | 8,320 | 7,576 | +9.8% |
| Gross profit (¥ million) | 899 | 649 | +38.5% |
| Gross margin | 10.8% | 8.6% | +2.2 pt |
| SG&A expenses (¥ million) | 481 | 499 | −3.6% |
| Operating profit (¥ million) | 418 | 149 | +179.8% |
| Ordinary profit (¥ million) | 420 | 149 | +180.8% |
| Net profit attrib. to owners of parent (¥ million) | 238 | 68 | +247.3% |
| Comprehensive income (¥ million) | 245 | 85 | +187.5% |
| EPS (¥) | 19.84 | 4.50 | +340.9% |
| Orders received (¥ million) | 11,655 | 9,396 | +24.0% |
| Order backlog (¥ million) | 37,744 | 31,698 | +19.1% |
| Civil Engineering — revenue (¥ million) | 2,416 | 2,274 | +6.2% |
| Civil Engineering — segment gross profit (¥ million) | 288 | 205 | +40.5% |
| Civil Engineering — orders received (¥ million) | 2,183 | 1,280 | +70.6% |
| Building Construction — revenue (¥ million) | 5,763 | 5,204 | +10.7% |
| Building Construction — segment gross profit (¥ million) | 606 | 454 | +33.4% |
| Building Construction — orders received (¥ million) | 9,331 | 8,018 | +16.4% |
| Ancillary Businesses — revenue (¥ million) | 140 | 97 | +44.5% |
| Ancillary Businesses — segment gross profit (¥ million) | 6 | −14 | loss to profit |
| Total assets (¥ million) | 22,251 | 25,352 | −12.2% |
| Net assets (¥ million) | 10,873 | 11,351 | −4.2% |
| Equity ratio | 48.9% | 44.8% | +4.1 pt |
| FY3/2027 guidance — revenue (¥ million) | 37,600 | — | +2.3% |
| FY3/2027 guidance — operating profit (¥ million) | 1,500 | — | −15.3% |
| FY3/2027 guidance — ordinary profit (¥ million) | 1,410 | — | −17.9% |
| FY3/2027 guidance — net profit (¥ million) | 910 | — | −5.6% |
| FY3/2027 guidance — EPS (¥) | 75.54 | — | — |
| Annual dividend per share (¥) | 60.00 | 60.00 | unchanged |
JapanStockPulse provides informational content only and does not constitute investment advice. Figures are taken from the company's published earnings short report and may be subject to subsequent revision.