The gap between 11.6% and 2.3%
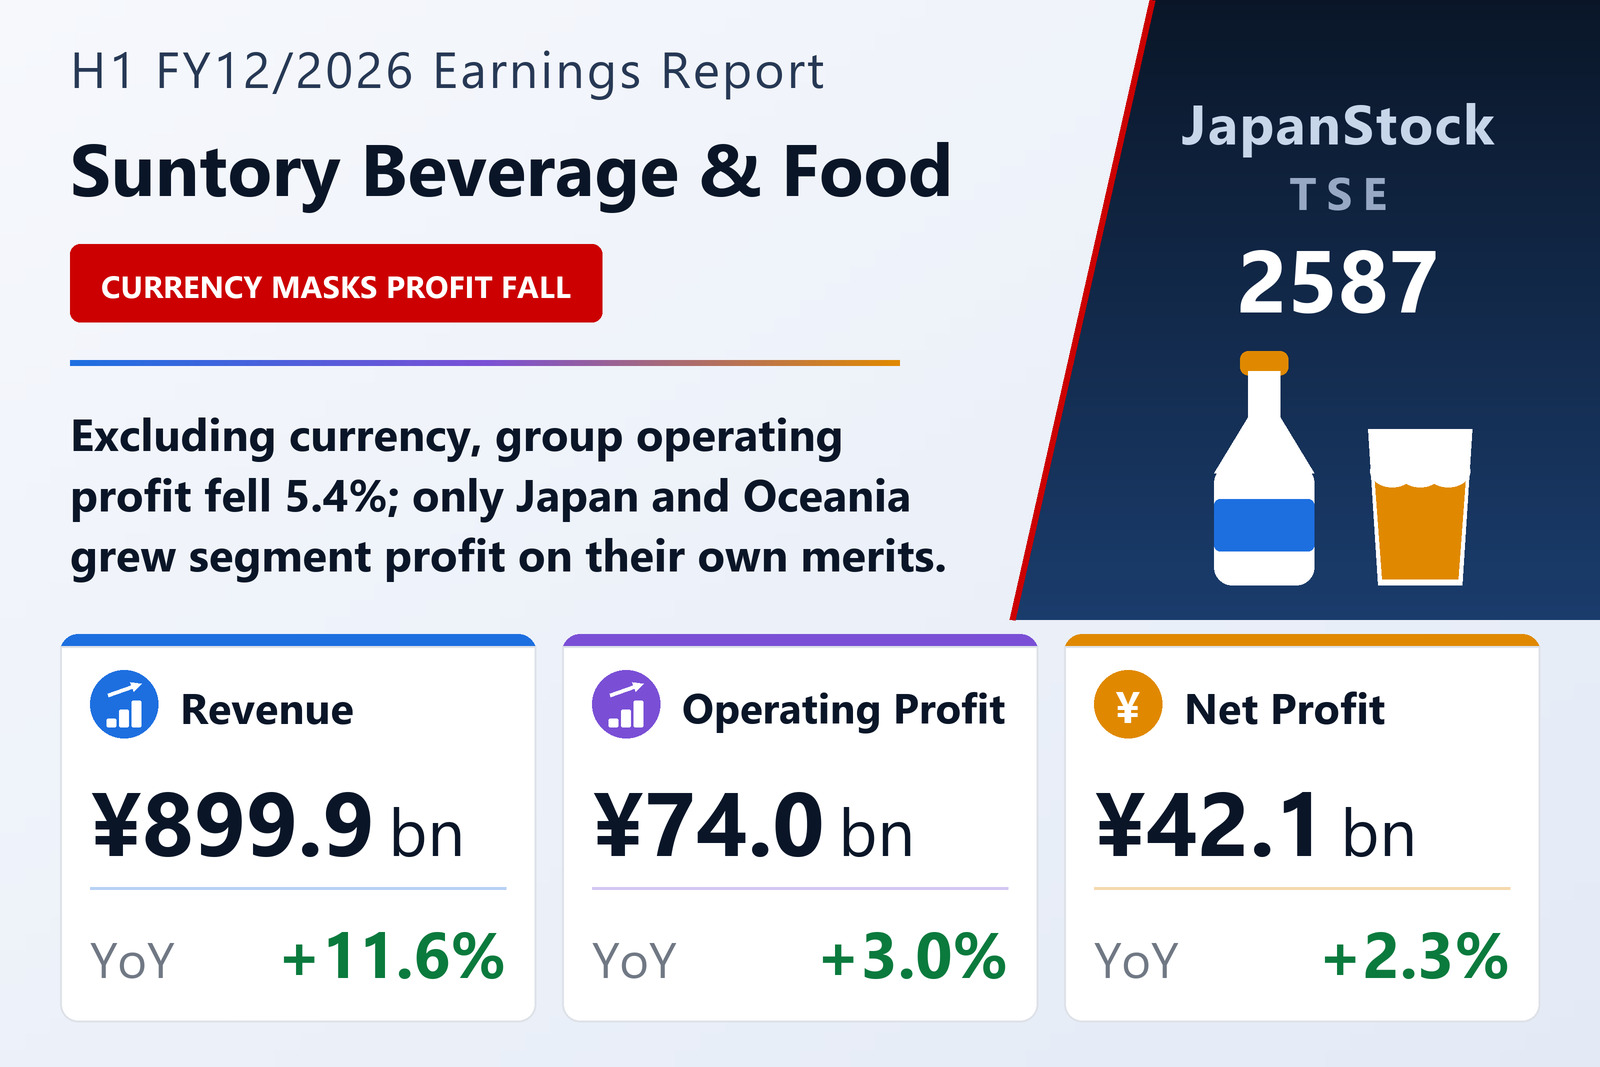
Suntory Beverage & Food Limited (TSE: 2587), the soft-drinks arm of the Suntory group and the company behind Suntory Tennensui mineral water, BOSS canned coffee and Iyemon tea in Japan, Lucozade in the United Kingdom and PEPSI and Aquafina in Vietnam and Thailand, published consolidated results for the six months ended June 30, 2026 under IFRS on August 6, 2026. Revenue rose 11.6% to ¥899,879 million from ¥806,411 million. Profit attributable to owners of the parent rose 2.3%, to ¥42,075 million from ¥41,138 million. The distance between those two growth rates is the whole of this result.
The company discloses currency-neutral figures alongside reported ones, and they invert the picture. Currency-neutral revenue grew 5.4%, not 11.6%. Currency-neutral operating profit fell 5.4%, where the reported figure rose 3.0% to ¥73,965 million. Currency-neutral attributable profit fell 6.3%. A weaker yen against every major operating currency supplied roughly six points of revenue growth — and rather more than the entirety of the operating-profit gain.
The reported operating margin fell to 8.2% from 8.9%, and the mechanics sit above it. Cost of sales rose 13.7% to ¥567,174 million against revenue's 11.6%, so gross profit grew only 8.2% to ¥332,705 million and the gross margin narrowed to 37.0% from 38.1%. Selling, general and administrative expenses then rose 9.9% to ¥256,363 million, faster again than gross profit. Raw-material and logistics inflation plus heavier marketing spend are the company's own explanation, and the arithmetic supports it.
Below the operating line the picture is better than above it. Net finance costs narrowed to ¥641 million from ¥1,649 million, as finance costs fell to ¥1,823 million from ¥3,030 million, so profit before tax rose 4.5% to ¥73,324 million — faster than operating profit. Tax of ¥19,915 million represented an effective rate of 27.2% against 26.1%, leaving profit for the period up 2.9% at ¥53,409 million. Non-controlling interests then took ¥11,333 million, up 5.3%, which is why the attributable figure grows slower still. Basic earnings per share were ¥136.17 against ¥133.13, with no dilution.
One structural note before the segments. The group reorganised its overseas businesses on January 1, 2026, replacing the former Japan / Asia-Pacific / Europe / Americas reporting split with Japan / Europe / Asia / Oceania / Americas. Prior-year figures below are restated on the new basis, so the comparisons are like-for-like — but Oceania has no history as a standalone segment before this year.
Japan: volume up in a shrinking market
Japan, the largest segment at 40.0% of external revenue, produced revenue of ¥360,091 million, up 4.6%, and segment profit of ¥21,325 million, up 16.8% — the second-fastest profit growth in the group, and achieved with no currency help whatsoever.
The volume story is the interesting part. On the company's own estimate, Japanese beverage market volume fell year on year as the effect of earlier price revisions continued to work through. SBF's own volume rose. Sustained core-brand investment plus new products, including the carbonated "Guilty Tansan NOPE", carried it. Suntory Tennensui grew volume on marketing and new launches; BOSS grew on "Craft BOSS Amakunai Italiano"; Iyemon grew across both large and small formats, with "Iyemon Koiaji", a food with function claims, holding firm. GREEN DA·KA·RA was the exception, falling on weakness in large-format packs. In the FOSHU and foods-with-function-claims category, "Tokusui", launched in October 2025, added incremental volume.
Segment profit rose because price revisions and the extra volume together outran higher raw-material and logistics costs. The segment margin widened to 5.9% from 5.3%. That is the lowest margin of the five segments — Japan is a scale business operating inside a tight domestic price structure — but it is the one moving in the right direction on domestic economics alone.
Europe: growth that exists only in yen
Europe reported revenue of ¥211,943 million, up 12.0%. Currency-neutral, it fell 0.7%. Segment profit fell 6.6% to ¥30,267 million as reported and 16.6% currency-neutral. Every yen of Europe's revenue growth, and then some, came from the exchange rate.
France saw volume decline again on weak consumption; revenue there rose only because of currency. The United Kingdom grew volume and revenue on Lucozade. Spain grew on portfolio expansion and heavier marketing. Against that, profit was hit by one-off costs from a plant reorganisation and by the increased marketing spend — which is why the currency-neutral profit decline is more than twenty times the currency-neutral revenue decline. The segment margin fell to 14.3% from 17.1%.
Europe remains the group's most profitable region in absolute terms: ¥30,267 million of segment profit against Japan's ¥21,325 million, on ¥148,148 million less revenue. That is precisely why a 16.6% currency-neutral profit decline there weighs on the group far more than its revenue share suggests.
Oceania: the one segment that did it without help
Oceania is the outlier of this result. Revenue rose 69.7% to ¥60,011 million, and 49.0% currency-neutral. Segment profit rose 156.2% to ¥5,241 million, and 106.2% currency-neutral — the only segment whose profit more than doubled on its own operating merits.
Two things drove it. Energy-drink volume rose year on year. And ready-to-drink alcohol, a category SBF launched in Australia in July 2025 and in New Zealand in January 2026, contributed: the Australian launch fell after the mid-point of the prior-year comparison period and the New Zealand launch is entirely new to this half, so neither has yet annualised. The segment margin reached 8.7% from 5.8%.
The caveat is scale. At ¥60,011 million of revenue Oceania is still the smallest of the five segments, 6.7% of the group total, and its ¥5,241 million of profit is 6.0% of the ¥87,021 million segment-profit pool. A segment that size cannot offset simultaneous currency-neutral profit declines in Europe, Asia and the Americas — which is exactly what the consolidated operating line shows.
Asia and the Americas: reported gains, currency-neutral losses
Asia produced revenue of ¥169,600 million, up 12.9% reported and 4.3% currency-neutral, with segment profit of ¥19,927 million, down 0.8% reported and 9.3% currency-neutral. Vietnam grew on marketing behind PEPSI in carbonates and Aquafina in water; Thailand grew on PEPSI; and the health-food business in Thailand and Indochina grew on both volume and currency. Underlying revenue is genuinely expanding here — the 4.3% currency-neutral gain is the second-best in the group after Oceania — but profit is not following it. The segment margin fell to 11.7% from 13.4%.
The Americas produced revenue of ¥98,233 million, up 12.5% reported and 5.5% currency-neutral, with segment profit of ¥10,260 million, up 0.1% reported and down 6.1% currency-neutral. Price revisions and new energy and carbonated products lifted the top line; manufacturing-cost inflation absorbed the benefit before it reached the profit line. The margin fell to 10.4% from 11.7%.
Add the five together and segment profit was ¥87,021 million, up 4.8%. Unallocated corporate costs then rose to ¥13,056 million from ¥11,217 million, an increase of ¥1,839 million, taking the consolidated operating figure to ¥73,965 million and its growth rate down to 3.0%.
The balance sheet grew on the same currency that flattered revenue
Total assets reached ¥2,294,954 million at June 30, 2026, up ¥76,939 million from December 31, 2025. The company attributes the increase to the weaker yen against major currencies plus higher trade and other receivables and higher inventories, and the sub-lines bear that out: trade and other receivables rose ¥23,644 million to ¥424,883 million and inventories rose ¥23,523 million to ¥161,051 million. Liabilities rose ¥28,469 million to ¥821,286 million, mainly on trade and other payables. Total equity rose ¥48,469 million to ¥1,473,667 million, on retained earnings plus a ¥14,949 million increase in other components of equity from the same currency move. Equity attributable to owners of the parent reached ¥1,354,262 million, and the ratio of equity attributable to owners slipped to 59.0% from 59.3% only because assets grew slightly faster than equity.
Operating cash flow was the standout: ¥71,169 million against ¥41,973 million, an increase of ¥29,196 million. Pre-tax profit of ¥73,324 million and depreciation and amortisation of ¥45,335 million, plus a ¥20,871 million increase in trade and other payables, were partly offset by an ¥18,285 million rise in trade and other receivables and a ¥21,267 million rise in inventories. Income taxes paid fell to ¥17,494 million from ¥22,378 million. Investing used ¥33,850 million against ¥40,486 million, with ¥34,910 million spent acquiring property, plant, equipment and intangibles. Financing used ¥27,949 million against ¥13,368 million — the ¥14,581 million increase reflecting ¥18,539 million of dividends to the parent's shareholders, ¥3,278 million to non-controlling interests and ¥6,877 million of lease-liability repayments. Cash and equivalents ended at ¥159,817 million, up ¥11,154 million from the December 31 balance.
Comprehensive income of ¥70,299 million, up 115.8% from ¥32,576 million, is the same currency effect appearing once more: the translation reserve on foreign operations swung to a ¥17,139 million gain from an ¥18,056 million loss, a ¥35,195 million swing that has nothing to do with trading.
Guidance unchanged, dividend unchanged — and an earthquake still being assessed
The company left its full-year FY12/2026 forecast exactly where it set it on February 12, 2026: revenue of ¥1,826,000 million, up 6.4%; operating profit of ¥155,000 million, up 4.2%; profit before tax of ¥154,000 million, up 4.8%; profit for the year of ¥110,500 million, up 0.3%; and profit attributable to owners of the parent of ¥89,000 million, up 0.3%, for basic EPS of ¥288.03.
Measured against that, the first half delivered 49.3% of guided revenue, 47.7% of guided operating profit and 47.3% of guided attributable profit — an ordinary-looking half. The more telling comparison is the growth rate: 6.4% of guided full-year revenue growth against 11.6% delivered in the first half, and 0.3% of guided attributable-profit growth against 2.3% delivered. Both imply a materially slower second half, which is what happens when a currency comparison hardens.
The dividend is likewise unchanged. ¥60.00 was set at the interim and ¥60.00 is forecast at the year-end, for ¥120.00 for the year — the same as FY12/2025. Against guided EPS of ¥288.03 that is a payout ratio of 41.7%. Shares issued stood at 309,000,000, unchanged, with 341 treasury shares against 340.
One risk is disclosed and not yet quantified. The Reiwa 8 Kumamoto earthquake in July 2026 — after the balance-sheet date — damaged parts of the Suntory Kyushu Kumamoto plant and other sites that manufacture soft drinks for the company under contract. SBF says it is still investigating the details, including the effect on its own results, and has made no change to guidance at this stage. The company adds that it expects highly uncertain conditions to persist and intends to pursue both volume expansion and profit growth across all five segments toward the forecast.
| Metric | H1 FY12/2026 | H1 FY12/2025 | Change |
|---|---|---|---|
| Revenue (¥ million) | 899,879 | 806,411 | +11.6% |
| Gross profit (¥ million) | 332,705 | 307,369 | +8.2% |
| Gross margin | 37.0% | 38.1% | −1.1 pt |
| Operating profit (¥ million) | 73,965 | 71,836 | +3.0% |
| Operating margin | 8.2% | 8.9% | −0.7 pt |
| Profit before tax (¥ million) | 73,324 | 70,187 | +4.5% |
| Profit for the period (¥ million) | 53,409 | 51,901 | +2.9% |
| Profit attrib. to owners of the parent (¥ million) | 42,075 | 41,138 | +2.3% |
| Comprehensive income (¥ million) | 70,299 | 32,576 | +115.8% |
| Basic EPS (¥) | 136.17 | 133.13 | +2.3% |
| Japan — revenue (¥ million) | 360,091 | 344,189 | +4.6% |
| Japan — segment profit (¥ million) | 21,325 | 18,252 | +16.8% |
| Europe — revenue (¥ million) | 211,943 | 189,261 | +12.0% |
| Europe — segment profit (¥ million) | 30,267 | 32,411 | −6.6% |
| Asia — revenue (¥ million) | 169,600 | 150,259 | +12.9% |
| Asia — segment profit (¥ million) | 19,927 | 20,095 | −0.8% |
| Oceania — revenue (¥ million) | 60,011 | 35,370 | +69.7% |
| Oceania — segment profit (¥ million) | 5,241 | 2,046 | +156.2% |
| Americas — revenue (¥ million) | 98,233 | 87,330 | +12.5% |
| Americas — segment profit (¥ million) | 10,260 | 10,247 | +0.1% |
| Operating cash flow (¥ million) | 71,169 | 41,973 | +69.6% |
| Investing cash flow (¥ million) | −33,850 | −40,486 | +6,636 |
| Financing cash flow (¥ million) | −27,949 | −13,368 | −14,581 |
| Cash and equivalents, period end (¥ million) | 159,817 | 145,882 | +9.6% |
| Total assets (¥ million, period-end) | 2,294,954 | 2,218,015 | +3.5% |
| Total equity (¥ million, period-end) | 1,473,667 | 1,425,198 | +3.4% |
| Equity attrib. to owners of the parent (¥ million, period-end) | 1,354,262 | 1,315,948 | +2.9% |
| Ratio of equity attrib. to owners | 59.0% | 59.3% | −0.3 pt |
| Interim dividend per share (¥) | 60.00 | 60.00 | Unchanged |
JapanStockPulse provides informational content only and does not constitute investment advice. Figures are taken from the company's published earnings short report and may be subject to subsequent revision.