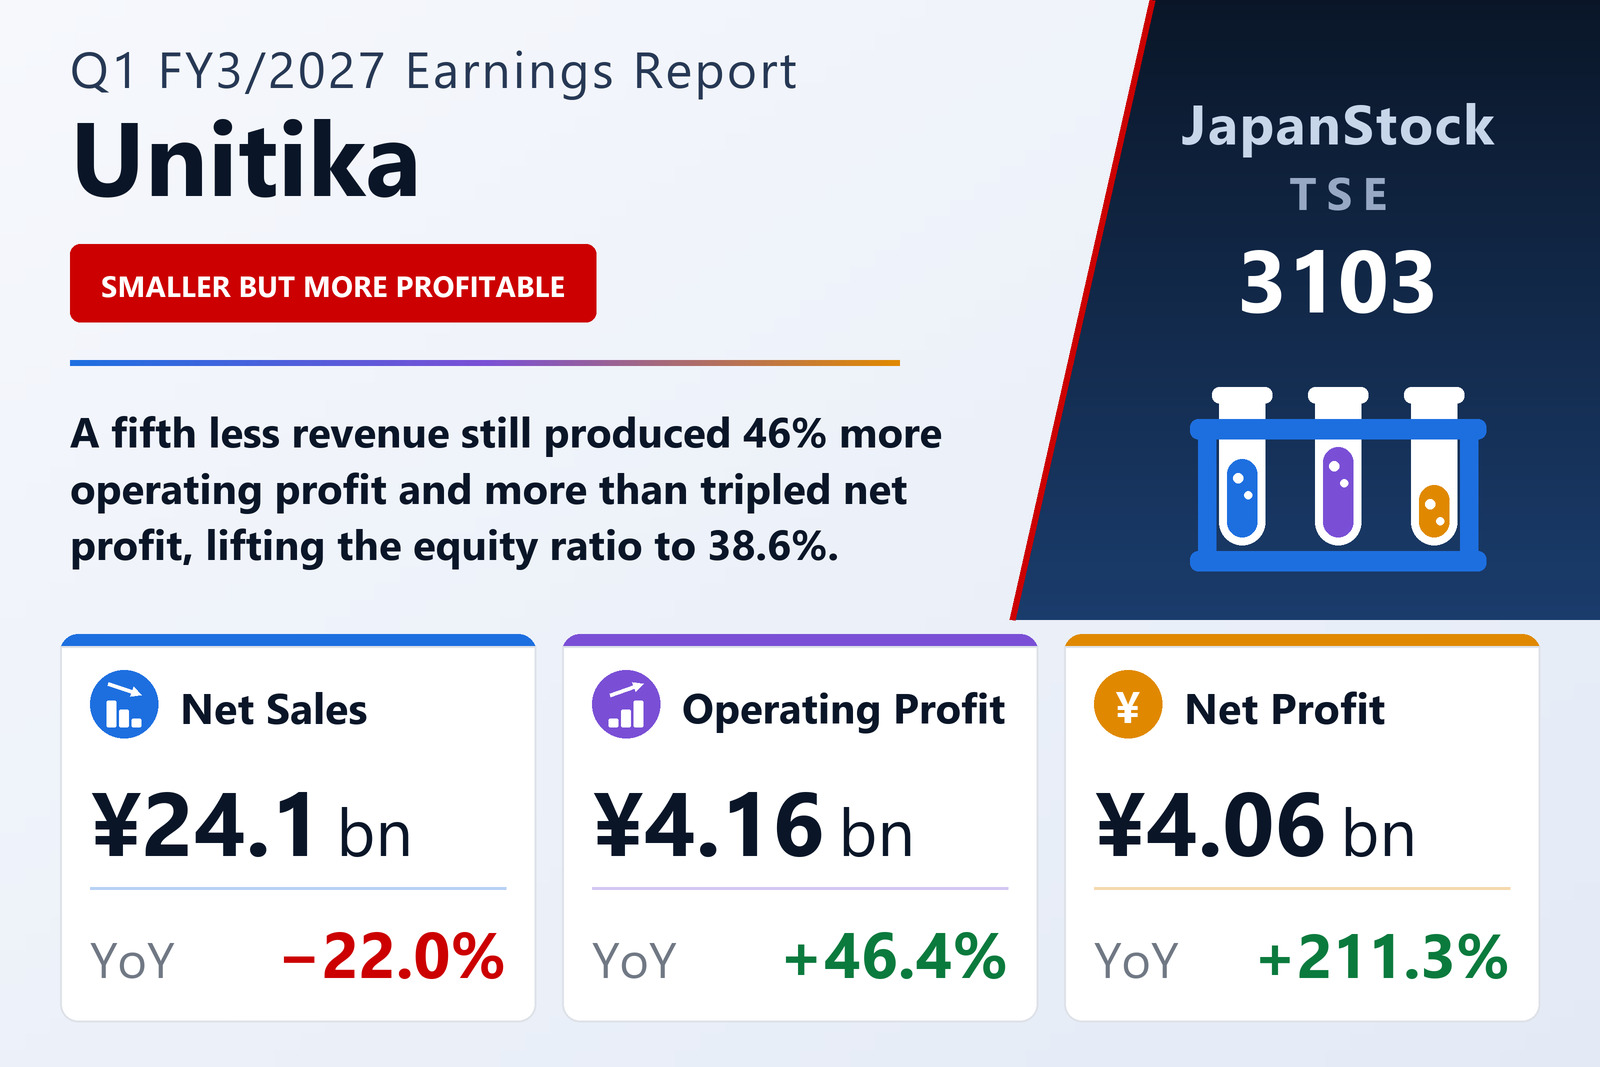
Unitika Ltd. (TSE: 3103) reported consolidated first-quarter results for the year to March 2027 under Japanese GAAP on August 6. Net sales fell 22.0% to ¥24,108 million, yet every profit line moved sharply the other way: operating profit rose 46.4% to ¥4,162 million, ordinary profit 135.7% to ¥4,322 million and profit attributable to owners of the parent 211.3% to ¥4,056 million. Basic earnings per share came in at ¥70.35 against ¥22.60 a year earlier, and comprehensive income reached ¥3,870 million, up 185.2%. For a company whose own full-year plan calls for revenue to fall by nearly a third, the combination of a shrinking top line and a tripling bottom line is not an accident — it is the design.
Revenue down a fifth, operating margin up eight points
The information in this quarter sits in the gap between the two ends of the income statement. Operating margin widened to 17.3% from 9.2%, an improvement of roughly eight percentage points achieved while shedding ¥6,802 million of quarterly revenue — the arithmetic of a portfolio being pruned rather than grown. Below the operating line the swing was larger still. Ordinary profit of ¥4,322 million came in above operating profit, implying net non-operating income of ¥160 million; a year earlier the same line ran ¥1,010 million against the company, dragging ordinary profit down to ¥1,834 million from an operating ¥2,844 million. That is a year-on-year improvement of about ¥1,170 million below the operating line alone, and it accounts for most of the difference between a 46% rise in operating profit and a 136% rise in ordinary profit.
The bottom line then lost remarkably little to tax and extraordinary items. Only ¥266 million separated ordinary profit from profit attributable to owners of the parent — an effective drag of 6.2%, far below Japan's statutory corporate burden of roughly 30%. That is the profile of a company still able to shelter current earnings against past losses, and it means each additional yen of operating improvement is currently reaching shareholders almost intact.
Preferred shares dominate the per-share arithmetic
The per-share figures are where Unitika's capital structure becomes impossible to ignore. Basic EPS of ¥70.35 collapses to a fully diluted ¥7.81 — barely one-ninth of the headline number. Working backwards from ¥4,056 million of profit, the diluted calculation implies roughly 519 million shares against an average of 57,653,797 ordinary shares actually outstanding, so the potential dilutive claim is on the order of 460 million shares, about eight times the existing common float. The prior-year quarter showed the same pattern (¥22.60 basic against ¥2.51 diluted), so this is a standing feature of the balance sheet, not a new event.
The dividend table makes the ranking explicit. Common shareholders received nothing in FY3/2026 and are forecast to receive nothing in FY3/2027 — ¥0.00 at every quarter and ¥0.00 for the year, unchanged from the company's previous announcement. The unlisted Class C preferred shares, by contrast, carried a ¥2.27 year-end dividend for FY3/2026 and are forecast at ¥3.18 for FY3/2027, a 40% increase. Issued shares stood at 57,752,343 with 98,588 held in treasury.
Balance sheet: equity ratio climbs to 38.6%
The quarter's retained profit went straight into the capital base. Net assets rose to ¥57,652 million at June 30 from ¥54,044 million at the March year-end, with shareholders' equity at ¥57,382 million against ¥53,784 million. Total assets, meanwhile, edged down to ¥148,775 million from ¥150,704 million. Rising equity against a slightly smaller asset base lifted the equity ratio to 38.6% from 35.7% — a 2.9-point gain in three months, and the single most consequential number in the release for a name whose recent history has been defined by balance-sheet repair. On this trajectory the ratio would clear 40% within the fiscal year without any further capital action.
Guidance untouched despite an unusually fast start
Unitika left its full-year FY3/2027 forecast exactly where it was: net sales of ¥84,000 million (−29.2%), operating profit of ¥8,000 million (−24.2%), ordinary profit of ¥6,500 million (−37.5%) and profit attributable to owners of ¥5,000 million (−72.5%), for forecast EPS of ¥80.35. Measured against that plan, the first quarter has already delivered 28.7% of the revenue, 52.0% of the operating profit, 66.5% of the ordinary profit and 81.1% of the full-year net profit — a pace that would ordinarily invite an upward revision. None was made, and the company also declined to revise its dividend forecast.
Two things explain the conservatism. First, working back from the guided percentages, FY3/2026 produced roughly ¥118.6 billion of sales, ¥10.6 billion of operating profit, ¥10.4 billion of ordinary profit and about ¥18.2 billion of net profit — a bottom line far above the ordinary line, the signature of large one-off gains that will not repeat. Against that base a 72.5% decline in net profit is a normalisation, not a deterioration. Second, the guided revenue contraction of nearly a third in a single year is steeper than any demand backdrop would explain on its own; it is the clearest signal in the document that the portfolio is still being reshaped, and the phasing of that reshaping through the remaining nine months is exactly the kind of uncertainty that argues for leaving a forecast alone in August. Note too that the forecast EPS of ¥80.35 sits below the ¥86.7 that ¥5,000 million divided by the current ordinary share count would produce — the gap is the preferred claim ranking ahead of common holders.
What the summary page discloses — and what sits in the attachments
There was no change to the scope of consolidation in the quarter, no special accounting treatments peculiar to interim reporting, and no changes to accounting policies, accounting estimates or restatements. As is standard for a tanshin, the quarterly consolidated financial statements have not been reviewed by a certified public accountant or audit corporation. The index to the attached materials lists notes on segment information, on significant changes in shareholders' equity, on the going-concern assumption and on the quarterly consolidated cash flow statement — so segment-level revenue and profit, which the summary page does not carry, are available only within the attachment, as is the cash flow detail. Supplementary explanatory materials were prepared, but no earnings briefing was held, and no dividend payment start date was set.
| Metric | Q1 FY3/2027 | Q1 FY3/2026 | YoY |
|---|---|---|---|
| Net sales (¥ million) | 24,108 | 30,910 | −22.0% |
| Operating profit (¥ million) | 4,162 | 2,844 | +46.4% |
| Operating margin | 17.3% | 9.2% | +8.1 pt |
| Ordinary profit (¥ million) | 4,322 | 1,834 | +135.7% |
| Profit attrib. to owners (¥ million) | 4,056 | 1,302 | +211.3% |
| Comprehensive income (¥ million) | 3,870 | 1,357 | +185.2% |
| Basic EPS (¥) | 70.35 | 22.60 | +211.3% |
| Diluted EPS (¥) | 7.81 | 2.51 | +211.2% |
| Total assets (¥ million, vs Mar 31, 2026) | 148,775 | 150,704 | −1.3% |
| Net assets (¥ million, vs Mar 31, 2026) | 57,652 | 54,044 | +6.7% |
| Shareholders' equity (¥ million, vs Mar 31, 2026) | 57,382 | 53,784 | +6.7% |
| Equity ratio (vs Mar 31, 2026) | 38.6% | 35.7% | +2.9 pt |
| Common dividend per share (¥, annual forecast) | 0.00 | 0.00 | Unchanged |
| Class C preferred dividend (¥, annual) | 3.18 | 2.27 | +40.1% |
JapanStockPulse provides informational content only and does not constitute investment advice. Figures are taken from the company's published earnings short report and may be subject to subsequent revision.