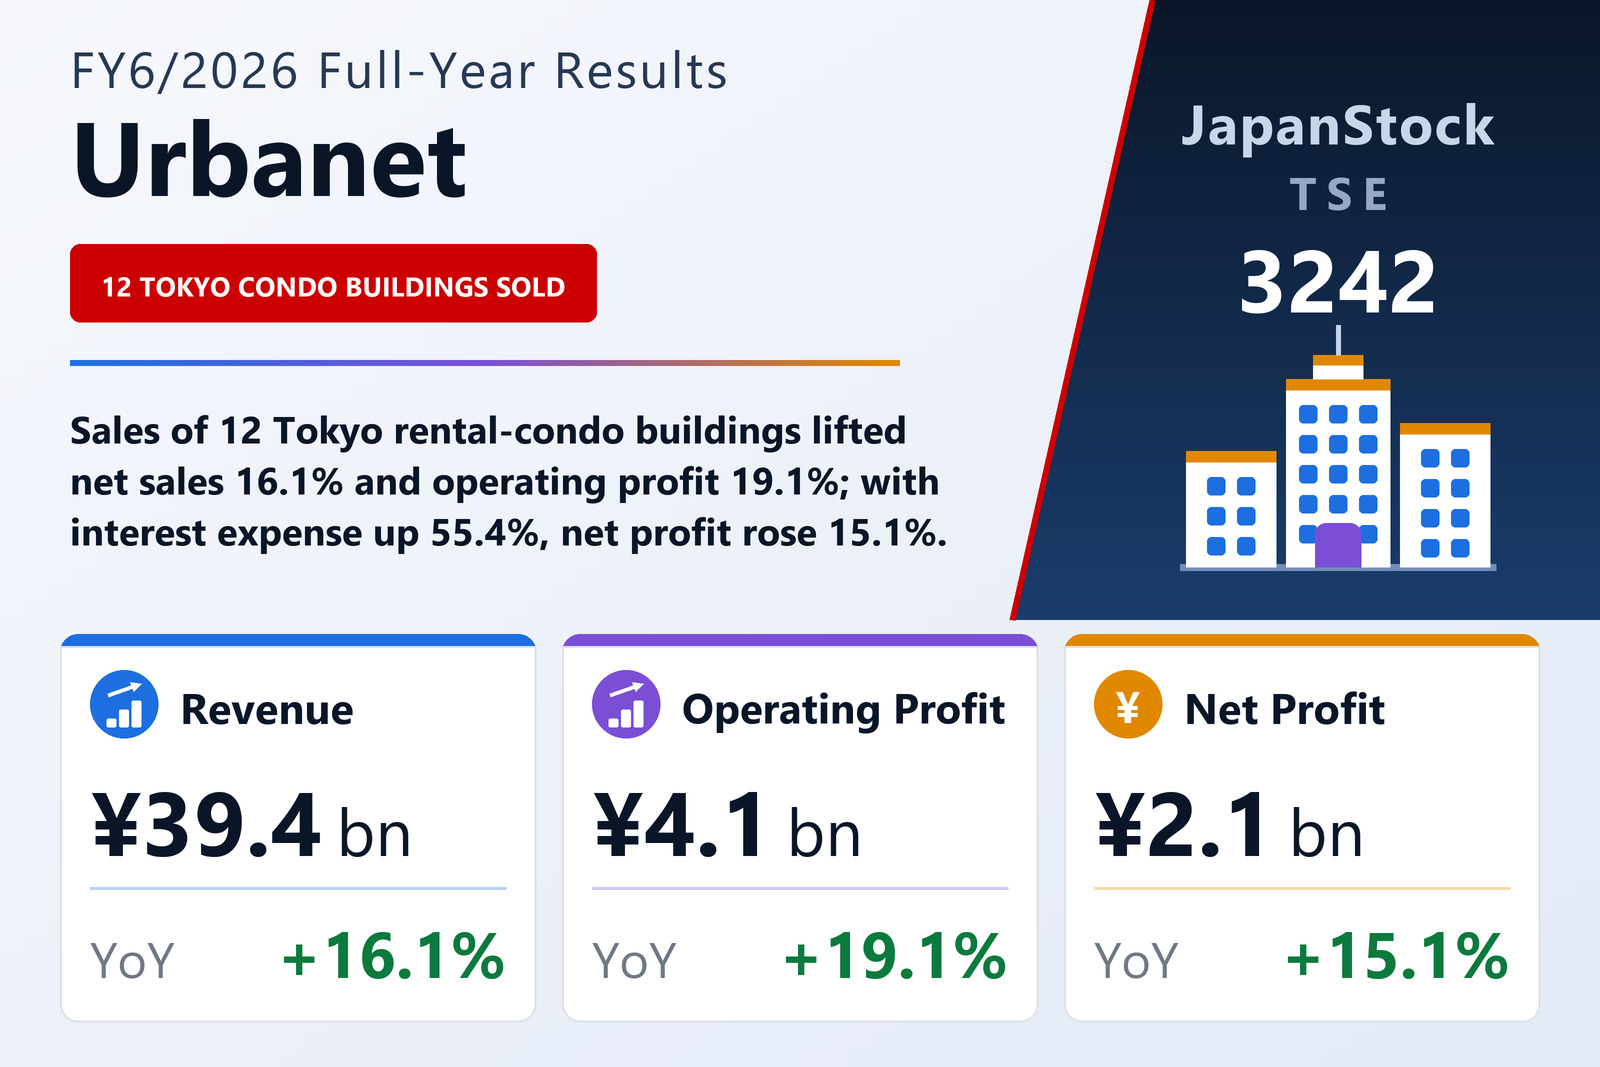
Twelve condominium buildings carried a 16% sales gain
URBANET CORPORATION CO., LTD. (TSE: 3242), a Tokyo developer that builds rental condominium buildings within the city's 23 wards and sells each one whole, published consolidated results for the fiscal year from July 1, 2025 to June 30, 2026 on August 6, 2026 under Japanese GAAP. Net sales rose 16.1% to ¥39,394 million, operating profit 19.1% to ¥4,147 million, ordinary profit 12.5% to ¥3,135 million and profit attributable to owners of the parent 15.1% to ¥2,129 million. The company says each of those figures beat its initial forecast for the year. Earnings per share rose only 3.4%, to ¥58.15 from ¥56.26, because the average share count grew 11.4% after holders exercised stock acquisition rights.
Almost all of the business is real estate. The Real Estate segment booked sales of ¥39,157 million, up 16.2%, and segment profit of ¥5,909 million, up 17.7%. Within it, development and sales brought in ¥38,025 million, up 18.3%, from 12 urban rental-condominium buildings totalling 541 units, 52 detached-house and townhouse units, and 13 plots sold as land. The company attributes the condominium result to completing every project scheduled for the year despite widespread worries over the supply of building materials — which it credits to long relationships with contractors and tight schedule control — and to strengthening and diversifying its relationships with buyers. The houses and townhouses were sold by a subsidiary that builds mainly in south-western Tokyo. Purchase-and-resale revenue fell 26.2% to ¥537 million (one used rental building and two used condominium units), and brokerage, leasing and other real-estate revenue fell 26.7% to ¥595 million.
The Hotel segment, a single hotel in Kamata, Tokyo, took ¥237 million of sales, down 0.4%, and ¥39 million of segment profit, down 14.5%. Room rates and occupancy held at roughly the prior year's level; the profit decline came from higher fees on domestic sales.
The margin widened at the gross line and mostly stopped there
Cost of sales rose 14.8% to ¥31,546 million, slower than sales, so gross profit grew 21.4% to ¥7,848 million and the gross margin widened from 19.0% to 19.9%. Selling, general and administrative expenses, however, rose 24.1% to ¥3,700 million. Fees paid rose to ¥481 million from ¥264 million and directors' remuneration to ¥424 million from ¥304 million — the two largest increases — while outsourcing costs more than doubled to ¥121 million and ¥39 million of goodwill amortisation appeared for the first time. The operating margin therefore improved only from 10.3% to 10.5%. Unallocated corporate costs — the gap between segment profit and operating profit — grew 13.7% to ¥1,800 million.
Financing costs absorbed almost half of the operating gain
Below the operating line, the cost of funding a growing land bank showed. Interest expense rose 55.4% to ¥757 million and loan-related fees booked as non-operating expenses rose 28.1% to ¥272 million, taking non-operating expenses to ¥1,031 million from ¥703 million against non-operating income of just ¥19 million. Operating profit grew by ¥666 million; ordinary profit grew by ¥348 million, so higher net financing costs absorbed close to half of the improvement. Extraordinary items were small — a ¥19 million gain on the sale of fixed assets against ¥25 million of disposal and impairment losses — and pre-tax profit came to ¥3,129 million, up 12.3%. Total income taxes rose only 6.8%, to ¥1,000 million: current taxes fell to ¥979 million from ¥1,285 million, more than offsetting the loss of the prior year's ¥348 million deferred-tax credit. The effective burden eased from about 33.6% to 32.0%, which is why net profit grew faster than ordinary profit.
A balance sheet 27% bigger, carried by borrowing
Total assets grew 26.8% to ¥79,050 million from ¥62,322 million a year earlier. Inventory rose ¥14,742 million as the company kept buying well-located condominium sites in Tokyo, bought land to meet demand for company housing and for hotel development in central Tokyo, and its house-building subsidiary bought sites for houses, townhouses and apartments; real estate for sale, including work in progress, reached ¥56,172 million against ¥41,431 million. Property and equipment grew ¥1,581 million on purchases of income-producing properties, and ¥278 million of goodwill appeared after that subsidiary acquired all the shares of Kagurazaka Heights, consolidated for the first time this year. Long-term borrowings, including the current portion, rose ¥12,475 million; with short-term loans, total borrowings reached ¥54,750 million against ¥41,582 million. Net assets grew 12.4% to ¥19,496 million, helped by ¥896 million raised through the exercise of stock acquisition rights, but the equity ratio fell from 27.8% to 24.7%.
Operating cash flow was an outflow of ¥9,690 million, against an outflow of ¥7,279 million a year earlier, because the ¥13,248 million increase in inventory outweighed pre-tax profit; the growth is being carried by borrowing rather than by operating cash. Investing activities used ¥3,232 million, including ¥2,286 million for property and equipment and ¥983 million for the subsidiary acquisition. Financing brought in ¥13,112 million — ¥29,997 million of new long-term borrowing less ¥17,522 million of repayments as buildings were sold, plus the ¥896 million from stock acquisition rights, less ¥839 million of dividends. Cash and equivalents ended the year at ¥11,587 million, up ¥189 million.
Guidance: more units, almost no profit growth, and a plan revision already flagged
For FY6/2027 Urbanet forecasts net sales of ¥43,500 million (+10.4%), operating profit of ¥4,200 million (+1.3%), ordinary profit of ¥3,150 million (+0.5%) and net profit of ¥2,150 million (+1.0%), or ¥58.24 per share. The plan covers 13 rental-condominium and similar buildings with 618 units — 576 of them already under sale contracts — plus 35 detached-house and townhouse units, seven apartment buildings for development and sale, and land resales: 653 condominium and house units against 593 this year. The filing does not explain why sales growing 10.4% would leave operating profit almost unchanged. It does say the forecast already exceeds the targets of its medium-term plan, and that it is reviewing that plan and intends to revise and publish it around its second-quarter results in early February 2027.
The dividend policy is to pay out 40% of net profit excluding the effect of deferred-tax adjustments. A separate release on the same day raised the FY6/2026 year-end dividend by ¥2 above forecast to ¥13.00, which with the ¥11.00 interim makes an annual ¥24.00 against ¥22.00, a payout ratio of 41.3%. For FY6/2027 the company plans ¥24.00 again, ¥12.00 at the interim and ¥12.00 at the year-end, a forecast payout of 41.2%.
| Metric | FY6/2026 | FY6/2025 | Change |
|---|---|---|---|
| Revenue (¥ million) | 39,394 | 33,933 | +16.1% |
| Gross profit (¥ million) | 7,848 | 6,463 | +21.4% |
| Gross margin | 19.9% | 19.0% | +0.9 pt |
| SG&A expenses (¥ million) | 3,700 | 2,981 | +24.1% |
| Operating profit (¥ million) | 4,147 | 3,481 | +19.1% |
| Operating margin | 10.5% | 10.3% | +0.2 pt |
| Interest expense (¥ million) | 757 | 487 | +55.4% |
| Ordinary profit (¥ million) | 3,135 | 2,787 | +12.5% |
| Pre-tax profit (¥ million) | 3,129 | 2,787 | +12.3% |
| Net profit attrib. to owners of parent (¥ million) | 2,129 | 1,850 | +15.1% |
| EPS (¥) | 58.15 | 56.26 | +3.4% |
| Real Estate — revenue (¥ million) | 39,157 | 33,695 | +16.2% |
| Real Estate — development & sales revenue (¥ million) | 38,025 | — | +18.3% |
| Real Estate — purchase & resale revenue (¥ million) | 537 | — | −26.2% |
| Real Estate — brokerage, leasing & other revenue (¥ million) | 595 | — | −26.7% |
| Real Estate — segment profit (¥ million) | 5,909 | 5,019 | +17.7% |
| Hotel — revenue (¥ million) | 237 | 238 | −0.4% |
| Hotel — segment profit (¥ million) | 39 | 45 | −14.5% |
| Total assets (¥ million) | 79,050 | 62,322 | +26.8% |
| Real estate for sale, incl. work in progress (¥ million) | 56,172 | 41,431 | +35.6% |
| Borrowings, short- and long-term (¥ million) | 54,750 | 41,582 | +31.7% |
| Net assets (¥ million) | 19,496 | 17,347 | +12.4% |
| Equity ratio | 24.7% | 27.8% | −3.1 pt |
| Operating cash flow (¥ million) | −9,690 | −7,279 | n.m. |
| FY6/2027 guidance — revenue (¥ million) | 43,500 | — | +10.4% |
| FY6/2027 guidance — operating profit (¥ million) | 4,200 | — | +1.3% |
| FY6/2027 guidance — ordinary profit (¥ million) | 3,150 | — | +0.5% |
| FY6/2027 guidance — net profit (¥ million) | 2,150 | — | +1.0% |
| FY6/2027 guidance — EPS (¥) | 58.24 | — | +0.2% |
| Annual dividend per share, FY6/2026 vs FY6/2025 (¥) | 24.00 | 22.00 | +9.1% |
| Annual dividend per share, FY6/2027 forecast vs FY6/2026 (¥) | 24.00 | 24.00 | unchanged |
JapanStockPulse provides informational content only and does not constitute investment advice. Figures are taken from the company's published earnings short report and may be subject to subsequent revision.