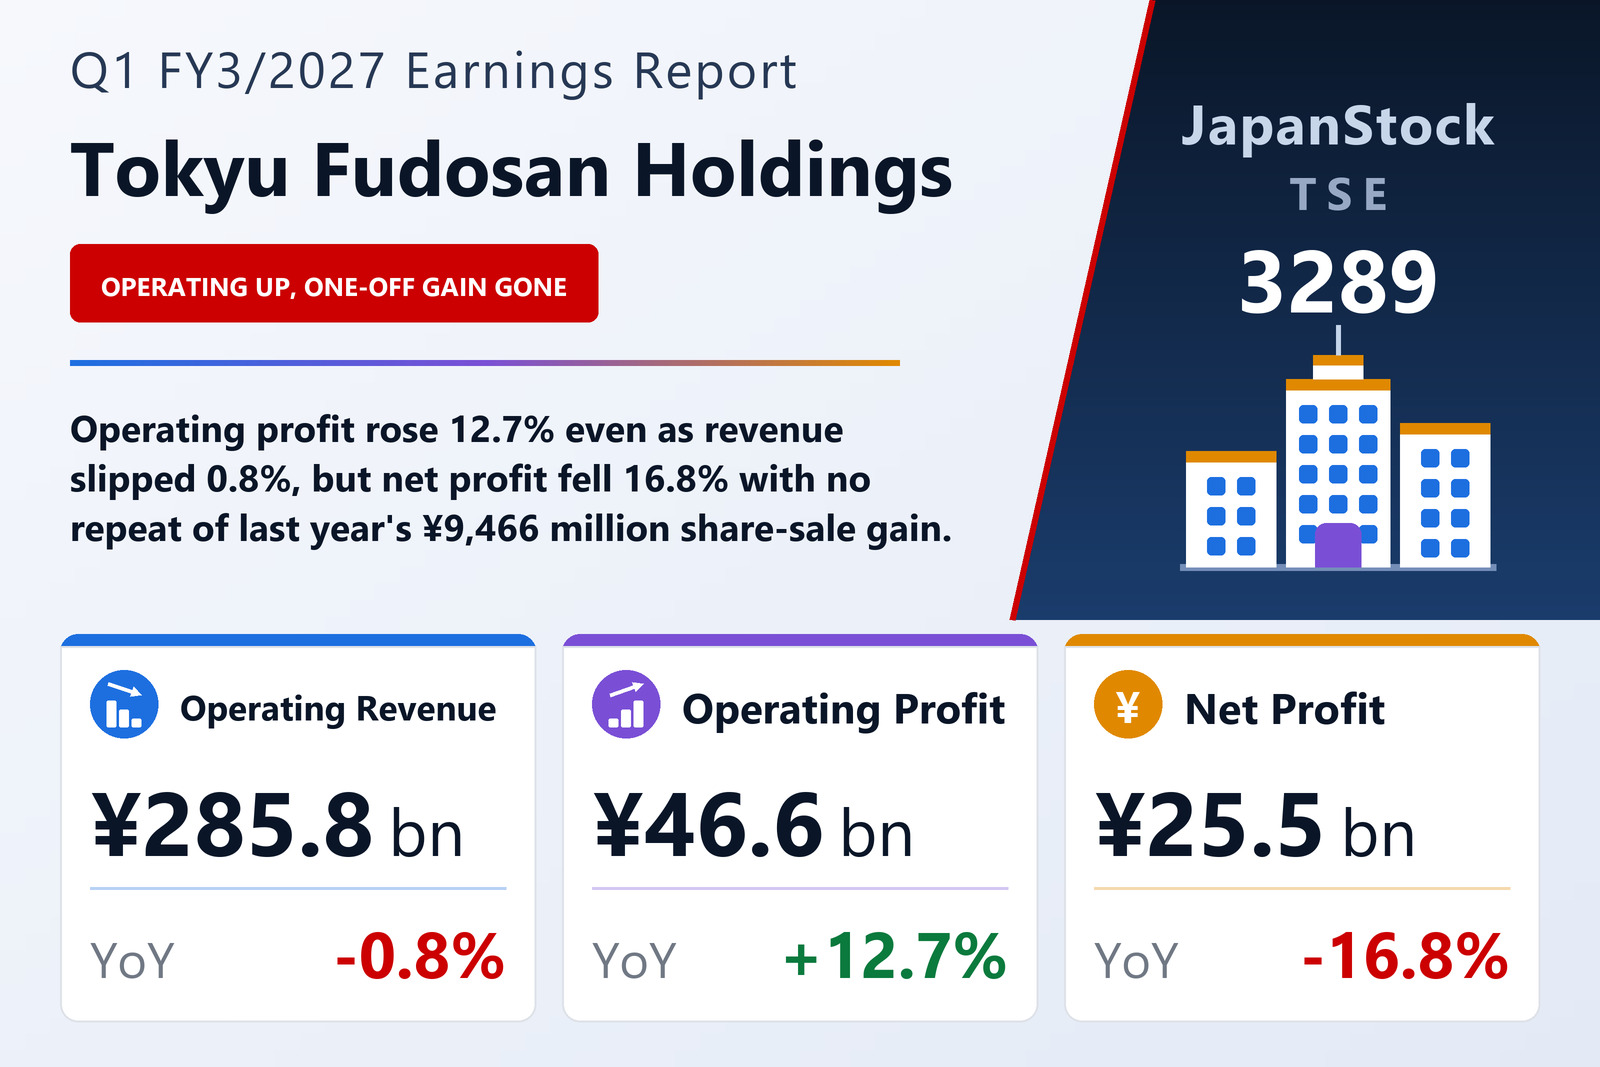
Operating revenue slipped 0.8%, yet operating profit rose 12.7%
Tokyu Fudosan Holdings Corporation (TSE: 3289), the holding company of a real estate group that develops, leases and operates office buildings, commercial facilities and housing, manages condominiums and buildings, and runs resort hotels, urban hotels, golf courses, ski resorts and senior housing, published consolidated first-quarter results for the three months from April 1 to June 30, 2026 on August 6, 2026 under Japanese GAAP. Operating revenue fell 0.8% to ¥285,774 million, operating profit rose 12.7% to ¥46,593 million and ordinary profit 8.6% to ¥40,725 million, while net profit attributable to owners of the parent fell 16.8% to ¥25,502 million, for earnings of ¥35.77 per share against ¥42.83. The filing names the Tokyo Stock Exchange as the listing venue and does not state a market segment.
The gap between those two top lines is where the quarter was made. Operating costs fell 5.1% to ¥209,700 million while operating revenue fell only 0.8%, so gross operating profit rose 13.4% to ¥76,074 million and the gross operating margin widened from 23.3% to 26.6% — a 3.3-point step on a revenue base of ¥285,774 million. Selling, general and administrative expenses grew 14.4% to ¥29,481 million, faster than either revenue or gross profit, which gave part of that gain back; the operating margin still improved from 14.4% to 16.3%. A group whose revenue shrank therefore earned ¥5,267 million more operating profit, and it did so on cost and mix alone.
Higher interest costs absorbed two fifths of the operating gain
Below the operating line the direction reverses. Non-operating expenses rose from ¥5,201 million to ¥7,672 million, driven by interest paid, which grew 35.7% to ¥6,135 million from ¥4,521 million, and by a swing in equity-method results from a ¥43 million profit to a ¥176 million loss. Non-operating income improved more modestly, from ¥1,384 million to ¥1,804 million, helped by subsidy income of ¥692 million against ¥417 million. Net non-operating expense therefore widened by ¥2,051 million, absorbing about two fifths of the ¥5,267 million operating gain and leaving ordinary profit up 8.6% against the operating line's 12.7%.
Net profit fell because a prior-year one-off did not repeat
The fall at the bottom line has a single identifiable cause, and it is not trading. In the year-earlier quarter the group booked ¥9,701 million of extraordinary income, of which ¥9,466 million was a gain on the sale of affiliate shares; this year it booked none, and recorded a ¥13 million loss on an affiliate-share sale instead. Pre-tax quarterly profit consequently fell 13.8%, from ¥47,210 million to ¥40,712 million, even as ordinary profit rose. Income taxes of ¥14,442 million against ¥16,470 million left quarterly profit at ¥26,269 million from ¥30,739 million, and because non-controlling interests took ¥766 million against ¥103 million a year earlier, profit attributable to owners of the parent fell 16.8% to ¥25,502 million. Measured before extraordinary items — that is, at ordinary profit — the same comparison is a rise of 8.6%.
Comprehensive income moved the opposite way from net profit, rising 65.9% to ¥31,514 million from ¥18,994 million. The filing's own other-comprehensive-income total was +¥5,244 million against −¥11,745 million, a swing of nearly ¥17,000 million that sits entirely outside the profit lines. Its largest component is the share of other comprehensive income of equity-method associates, +¥3,726 million against −¥10,006 million; foreign-currency translation adjustments also turned, to +¥1,020 million from −¥5,942 million. Unrealised gains on available-for-sale securities went the other way, to −¥609 million from +¥3,423 million.
Management and Operation carried the quarter; Urban Development gave back a quarter of its revenue
The four reporting segments moved in sharply different directions, and the group's profit rise is almost entirely one of them. Management & Operation — comprehensive management and renovation of condominiums and buildings, membership resort hotels, urban hotels, golf courses, ski resorts and senior housing, plus environmental greening — grew revenue 25.8% to ¥101,324 million and segment profit 374.4% to ¥21,157 million from ¥4,460 million, a gain of ¥16,697 million on its own. Strategic Investment — renewable-energy generation plants, logistics facilities, REIT and fund management and overseas development investment — grew revenue 29.1% to ¥23,533 million and returned to a segment profit of ¥590 million from a ¥593 million loss. Against those, Urban Development — office, retail and housing development, leasing and condominium sales — fell 26.4% to ¥72,339 million of revenue and 46.2% to ¥11,596 million of segment profit, and Real Estate Agency — brokerage, buy-and-resell, sales agency and rental and student-housing management — fell 6.7% to ¥95,032 million and 20.1% to ¥16,345 million. These segment revenues include intersegment sales and transfers, eliminated at ¥6,455 million against ¥10,991 million a year earlier.
The swing between two of them is the quarter in one line: Urban Development lost ¥9,977 million of segment profit and Management & Operation gained ¥16,697 million, with Real Estate Agency giving back a further ¥4,124 million. The corporate adjustment was a charge of ¥3,097 million against ¥4,584 million, of which goodwill amortisation was ¥588 million in both periods and unallocated holding-company costs ¥2,471 million against ¥2,121 million; the rest is intersegment elimination, which fell to ¥37 million from ¥1,874 million. The filing gives no explanation for any of these movements. Its overview-of-results section — the place a Japanese quarterly earnings report normally sets out causes — refers readers instead to the earnings presentation posted on the company's website the same day, so this report states what the segment note shows and does not attribute it.
A larger balance sheet, funded with new commercial paper
Total assets rose 1.7% to ¥3,475,651 million from ¥3,419,052 million at March 31, 2026, and net assets 1.5% to ¥929,992 million, of which equity attributable to owners of the parent was ¥910,719 million against ¥898,082 million. The equity ratio eased from 26.3% to 26.2% and net assets per share rose to ¥1,276.89 from ¥1,260.05. Inside the asset total the composition moved: real estate held for sale rose ¥56,807 million to ¥672,260 million while cash and deposits fell ¥35,113 million to ¥152,700 million, investment securities rose ¥17,849 million to ¥416,382 million and goodwill amortised down to ¥48,013 million from ¥49,269 million.
The funding side shows where that came from. The group drew ¥93,000 million of commercial paper, a line that stood at zero on March 31, 2026, while short-term borrowings fell ¥24,305 million to ¥181,837 million and long-term borrowings rose ¥21,282 million to ¥1,300,874 million; bonds were unchanged at ¥331,050 million plus ¥10,160 million due within a year. Summed, those interest-bearing items stood at ¥1,916,921 million against ¥1,826,944 million three months earlier, an increase of ¥89,977 million. No quarterly consolidated statement of cash flows was prepared; instead the filing discloses depreciation of ¥16,544 million against ¥15,604 million and goodwill amortisation of ¥1,255 million against ¥1,230 million. Tax expense for the quarter is computed using an estimated effective rate for the full year rather than a statutory calculation, a simplification the filing flags explicitly.
Guidance and dividend both left exactly where they were
Tokyu Fudosan Holdings kept its full-year FY3/2027 guidance unchanged, stating that there has been no revision to the most recently published forecast. It expects operating revenue of ¥1,400,000 million (+12.4%), operating profit of ¥190,000 million (+13.9%), ordinary profit of ¥161,000 million (+8.9%) and profit attributable to owners of ¥100,000 million (+3.4%), for earnings of ¥140.02 per share. The first quarter delivered 20.4% of guided full-year revenue but 24.5% of guided operating profit and 25.5% of guided net profit — profit a quarter of the way through the year while revenue is a fifth of the way. The filing does not set out the shape it expects for the remaining nine months.
The dividend forecast was likewise left alone, at ¥25.00 for the second quarter and ¥25.00 at the year-end, for an annual ¥50.00 against ¥48.00 paid for FY3/2026 — a rise of 4.2% and a payout of about 36% of guided earnings per share. No first-quarter dividend was declared and no payment start date is given. Issued shares were unchanged at 719,830,974, while treasury stock fell by 497,109 shares to 6,599,668, and the weighted-average share count for the quarter was 712,977,796 against 715,287,762. One comparative caveat applies throughout: the filing notes that provisional accounting for a business combination was finalised during FY3/2026, and the FY3/2026 first-quarter figures shown here already reflect that finalisation.
| Metric | Q1 FY3/2027 | Q1 FY3/2026 | Change |
|---|---|---|---|
| Operating revenue (¥ million) | 285,774 | 287,983 | −0.8% |
| Gross profit (¥ million) | 76,074 | 67,088 | +13.4% |
| SG&A expenses (¥ million) | 29,481 | 25,762 | +14.4% |
| Operating profit (¥ million) | 46,593 | 41,326 | +12.7% |
| Operating margin | 16.3% | 14.4% | +1.9 pt |
| Ordinary profit (¥ million) | 40,725 | 37,509 | +8.6% |
| Net profit attrib. to owners of parent (¥ million) | 25,502 | 30,636 | −16.8% |
| Comprehensive income (¥ million) | 31,514 | 18,994 | +65.9% |
| EPS (¥) | 35.77 | 42.83 | −16.5% |
| Urban Development — revenue (¥ million) | 72,339 | 98,325 | −26.4% |
| Urban Development — segment profit (¥ million) | 11,596 | 21,573 | −46.2% |
| Strategic Investment — revenue (¥ million) | 23,533 | 18,228 | +29.1% |
| Strategic Investment — segment profit (¥ million) | 590 | −593 | loss to profit |
| Management & Operation — revenue (¥ million) | 101,324 | 80,543 | +25.8% |
| Management & Operation — segment profit (¥ million) | 21,157 | 4,460 | +374.4% |
| Real Estate Agency — revenue (¥ million) | 95,032 | 101,877 | −6.7% |
| Real Estate Agency — segment profit (¥ million) | 16,345 | 20,469 | −20.1% |
| Total assets (¥ million) | 3,475,651 | 3,419,052 | +1.7% |
| Net assets (¥ million) | 929,992 | 916,600 | +1.5% |
| Equity ratio | 26.2% | 26.3% | −0.1 pt |
| FY3/2027 guidance — operating revenue (¥ million) | 1,400,000 | — | +12.4% |
| FY3/2027 guidance — operating profit (¥ million) | 190,000 | — | +13.9% |
| FY3/2027 guidance — ordinary profit (¥ million) | 161,000 | — | +8.9% |
| FY3/2027 guidance — net profit (¥ million) | 100,000 | — | +3.4% |
| FY3/2027 guidance — EPS (¥) | 140.02 | — | n.m. |
| Annual dividend per share (¥) | 50.00 | 48.00 | +4.2% |
JapanStockPulse provides informational content only and does not constitute investment advice. Figures are taken from the company's published earnings short report and may be subject to subsequent revision.