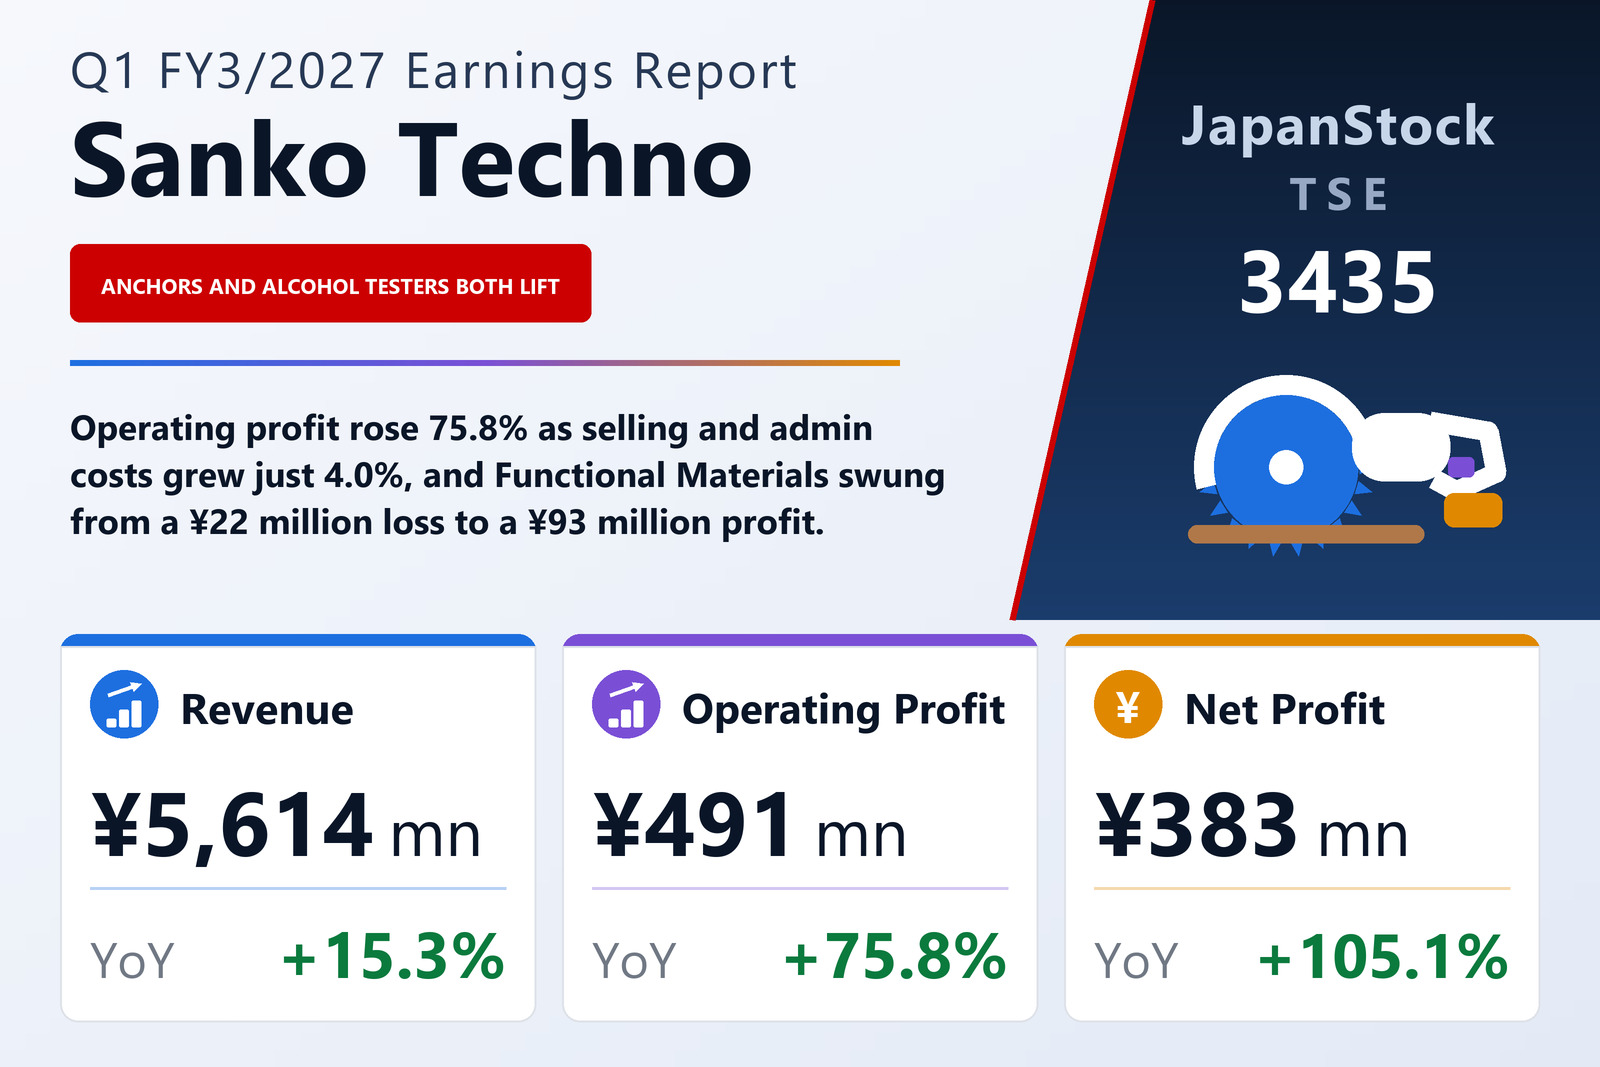
Revenue up 15.3%, operating profit up 75.8% — and SG&A is most of the difference
Sanko Techno Co., Ltd. (TSE: 3435), the fastening-hardware and functional-materials group whose mainstay product is the post-installed anchor used to fix fittings into finished concrete, published consolidated first-quarter results for the three months from April 1 to June 30, 2026 on August 6, 2026 under Japanese GAAP. Revenue rose 15.3% to ¥5,614 million, operating profit 75.8% to ¥491 million, ordinary profit 86.8% to ¥521 million and profit attributable to owners of the parent 105.1% to ¥383 million, for earnings of ¥48.41 per share against ¥23.63. The filing names the Tokyo Stock Exchange as the listing venue.
The step from a 15.3% revenue gain to a 75.8% operating-profit gain is arithmetic, and it is worth setting out because it is most of the quarter. Cost of sales rose 14.2% to ¥3,885 million, a little more slowly than revenue, so gross profit grew 17.7% to ¥1,728 million and the gross margin widened from 30.16% to 30.79% — a gain of 0.63 of a point. The larger move sits below that line: selling, general and administrative expenses rose only 4.0% to ¥1,237 million, less than a third of the rate of revenue, so the SG&A ratio fell from 24.43% to 22.04%. The two spreads together took the operating margin from 5.74% to 8.75%, and roughly four fifths of that three-point gain came from the cost line rather than from pricing.
A silent-partnership gain is what carries the ordinary line past the operating one
Ordinary profit rose 86.8% to ¥521 million, eleven percentage points faster than the operating line, and a single item accounts for almost all of that extra step. Non-operating income rose 82.6%, to ¥68 million from ¥37 million, on a ¥39 million gain from a silent-partnership investment that was nil a year earlier; against it, the ¥9 million foreign-exchange gain booked in the prior-year quarter did not recur, and a small exchange loss of ¥0.5 million took its place. Non-operating expenses were flat at ¥38 million against ¥37 million, with interest paid rising to ¥10 million from ¥7 million and sales discounts easing to ¥25 million from ¥26 million. Strip the silent-partnership gain out and ordinary profit would have grown at roughly the operating line's pace, about 72.8%.
Below that the quarter is made of small items. Extraordinary gains were ¥1.8 million — ¥1.7 million from selling investment securities and ¥0.1 million from selling fixed assets — against extraordinary losses of ¥0.5 million on fixed-asset retirements, so pre-tax profit of ¥522 million was up 86.3%. Income taxes of ¥138 million rose 53.5%, far less than pre-tax profit, and the implied effective rate fell from 32.2% to 26.5%. That rate is an estimate rather than a calculation: the filing states that it applies the special quarterly treatment of estimating the effective tax rate for the full financial year and applying it to quarterly pre-tax profit. Quarterly profit was ¥384 million, of which ¥0.9 million was attributed to non-controlling interests against ¥3 million a year earlier, leaving ¥383 million for owners of the parent.
Comprehensive income was ¥398 million against ¥23 million, a seventeen-fold step that no profit line beneath it matches. The reason is other comprehensive income, which swung from −¥167 million to +¥14 million: unrealised gains on available-for-sale securities turned from −¥41 million to +¥70 million, while the foreign-currency translation adjustment stayed negative but narrowed, from −¥126 million to −¥56 million. That swing is an accounting one rather than a trading one, which is why comprehensive income moved so much further than profit.
Anchors held through a price rise; alcohol testers turned the smaller segment around
Fastening, the larger of the two reporting segments at 77% of external revenue, grew 12.0% to ¥4,330 million, with segment profit up 22.5% to ¥643 million. The filing's account is product by product: post-installed anchors, which it calls the company's mainstay product, held firm even though a price revision took effect in June 2026; electro-hydraulic tools ran level with the prior year; and completed construction works fell below it. The price revision is the most consequential of those three, because a price increase that demand absorbs lands directly on the margin — and segment profit growing at nearly twice the rate of segment revenue is what that looks like.
Functional Materials is the smaller segment and did the more dramatic thing: revenue rose 27.6% to ¥1,283 million and it swung from a segment loss of ¥22 million to a segment profit of ¥93 million. The filing credits alcohol detectors, led by automated roll-call systems, which it describes as strong and ahead of the prior year; packaging and logistics equipment also grew, electronic substrates were level, and FRP sheets fell. In absolute terms the two segments contributed almost equally to the quarter: Fastening added ¥118 million of segment profit and Functional Materials ¥115 million, even though one grew 22.5% and the other crossed from loss into profit. Those segment revenues are sales to external customers; intersegment sales and transfers of ¥45 million are eliminated on consolidation. Unallocated corporate costs, charged to neither segment, rose 9.5% to ¥252 million, and the whole reconciling item between segment profit of ¥736 million and reported operating profit of ¥491 million was −¥245 million.
The balance sheet shrank, and that is why the equity ratio rose
Total assets fell 2.5% to ¥28,024 million from ¥28,752 million at March 31, 2026, a reduction of ¥727 million. Current assets did all of it, falling 4.3% to ¥16,829 million: notes and accounts receivable and contract assets dropped ¥980 million to ¥3,469 million while cash and deposits rose ¥254 million to ¥5,053 million, which is collection turning receivables into cash rather than any change in the size of the business. Non-current assets were essentially unchanged, up 0.2% to ¥11,195 million.
Liabilities fell faster than assets, down 9.4% to ¥7,621 million. Current liabilities fell 10.0% to ¥3,980 million, with income taxes payable down to ¥158 million from ¥362 million and the bonus provision up to ¥303 million from ¥163 million; non-current liabilities fell 8.8% to ¥3,641 million, chiefly because long-term borrowings were repaid down to ¥2,184 million from ¥2,525 million. Adding bonds to both the current and non-current borrowings, interest-bearing debt was ¥3,527 million against ¥3,952 million, down 10.8% in a single quarter. Net assets edged up 0.3% to ¥20,403 million: retained earnings rose only ¥50 million, because the quarter's ¥383 million of profit was almost entirely offset by the ¥42.00 per share FY3/2026 year-end dividend paid during it. With liabilities down and equity up, the equity ratio rose from 69.4% to 71.4%. No quarterly cash-flow statement was prepared; the filing discloses depreciation of ¥93 million and goodwill amortisation of ¥4 million, both close to the prior year.
Guidance is for a full-year decline, and the first quarter is already most of the half
Sanko Techno left both of its forecasts unchanged from the ones published on May 13, 2026. For the first half it guides revenue of ¥11,000 million (+7.1%), operating profit of ¥700 million (−6.2%), ordinary profit of ¥700 million (−15.2%) and net profit of ¥500 million (−10.9%), for earnings of ¥63.18 per share. For the full year to March 31, 2027 it guides revenue of ¥24,000 million (+10.3%), operating profit of ¥1,770 million (−1.3%), ordinary profit of ¥1,780 million (−4.1%) and profit attributable to owners of ¥1,250 million (−21.5%), for earnings of ¥157.94 per share.
Set the quarter just reported against those numbers and the shape is unusual. Q1 revenue of ¥5,614 million is 51.0% of the guided half and 23.4% of the guided year, which is roughly a normal quarter. But Q1 operating profit of ¥491 million is 70.2% of the guided half and 27.7% of the guided year, and Q1 net profit of ¥383 million is 76.6% of the guided half. Taken literally, guidance implies operating profit of about ¥208 million in the July-to-September quarter against the ¥491 million just booked, and about ¥1,070 million across the whole second half. The filing neither revises the forecast nor explains the gap; its only comment on the subject is that the May 13 numbers are unchanged.
Two features of the full-year guidance are worth separating. Revenue is guided up 10.3% while every profit line is guided down, so the company is forecasting a year in which it grows and earns less — the opposite of the quarter it has just reported, and the filing gives no reason for it. And the guided decline steepens the further down the income statement it goes, from −1.3% at the operating line to −4.1% at the ordinary line and −21.5% at the net line. The 17-point gap between the ordinary and net declines sits below the ordinary line, in tax or in items that do not recur, and the filing does not identify it.
Dividend raised to ¥46.00, all of it paid at the year-end
The dividend forecast was left unchanged as well. Sanko Techno intends to pay ¥46.00 per share for FY3/2027 against ¥42.00 for FY3/2026, a rise of 9.5%, and — as in the prior year — the whole of it at the year-end, with nothing at the half: the second-quarter dividend is forecast at ¥0.00, and no payment start date is given in this filing. Against guided earnings of ¥157.94 per share, that is a payout ratio of about 29%.
The housekeeping in the filing is unremarkable, which is itself worth recording. There was no change in the scope of consolidation, no change in accounting policies, no change in accounting estimates and no restatement; the only special treatment applied is the estimated annual effective tax rate noted above. Issued shares were unchanged at 8,745,408 and treasury shares rose by 96 to 831,039, leaving an average of 7,914,369 shares for the quarter against 7,907,565 a year earlier. The quarterly statements have not been reviewed by a certified public accountant or an audit corporation, and the company prepared no supplementary briefing materials and held no results presentation. It restates its medium-term plan, 'S.T.G Vision2026', which began in FY3/2025 and ends in FY3/2027, and lists its themes as human-resource development, overall optimisation and new-business creation. Its description of the construction market is of labour shortages from the 2024 overtime regulation feeding through into schedule delays, and of steel prices turning from a high plateau back upward, against demand held up by infrastructure work.
| Metric | Q1 FY3/2027 | Q1 FY3/2026 | Change |
|---|---|---|---|
| Revenue (¥ million) | 5,614 | 4,871 | +15.3% |
| Gross profit (¥ million) | 1,728 | 1,469 | +17.7% |
| Gross margin | 30.79% | 30.16% | +0.63 pt |
| SG&A expenses (¥ million) | 1,237 | 1,189 | +4.0% |
| Operating profit (¥ million) | 491 | 279 | +75.8% |
| Operating margin | 8.75% | 5.74% | +3.01 pt |
| Ordinary profit (¥ million) | 521 | 279 | +86.8% |
| Net profit attrib. to owners of parent (¥ million) | 383 | 186 | +105.1% |
| EPS (¥) | 48.41 | 23.63 | +104.9% |
| Comprehensive income (¥ million) | 398 | 23 | +1,615.1% |
| Fastening — revenue (¥ million) | 4,330 | 3,865 | +12.0% |
| Fastening — segment profit (¥ million) | 643 | 525 | +22.5% |
| Functional Materials — revenue (¥ million) | 1,283 | 1,006 | +27.6% |
| Functional Materials — segment profit (¥ million) | 93 | −22 | loss to profit |
| Segment profit adjustment (incl. unallocated corporate expense) (¥ million) | −245 | −223 | +10.0% |
| Cash and deposits (¥ million) | 5,053 | 4,798 | +5.3% |
| Interest-bearing debt (bonds and borrowings) (¥ million) | 3,527 | 3,952 | −10.8% |
| Total assets (¥ million) | 28,024 | 28,752 | −2.5% |
| Net assets (¥ million) | 20,403 | 20,337 | +0.3% |
| Shareholders' equity (¥ million) | 20,021 | 19,951 | +0.4% |
| Equity ratio | 71.4% | 69.4% | +2.0 pt |
| FY3/2027 guidance — revenue (¥ million) | 24,000 | — | +10.3% |
| FY3/2027 guidance — operating profit (¥ million) | 1,770 | — | −1.3% |
| FY3/2027 guidance — ordinary profit (¥ million) | 1,780 | — | −4.1% |
| FY3/2027 guidance — net profit (¥ million) | 1,250 | — | −21.5% |
| FY3/2027 guidance — EPS (¥) | 157.94 | — | — |
| Annual dividend per share (¥) | 46.00 | 42.00 | +9.5% |
JapanStockPulse provides informational content only and does not constitute investment advice. Figures are taken from the company's published earnings short report and may be subject to subsequent revision.