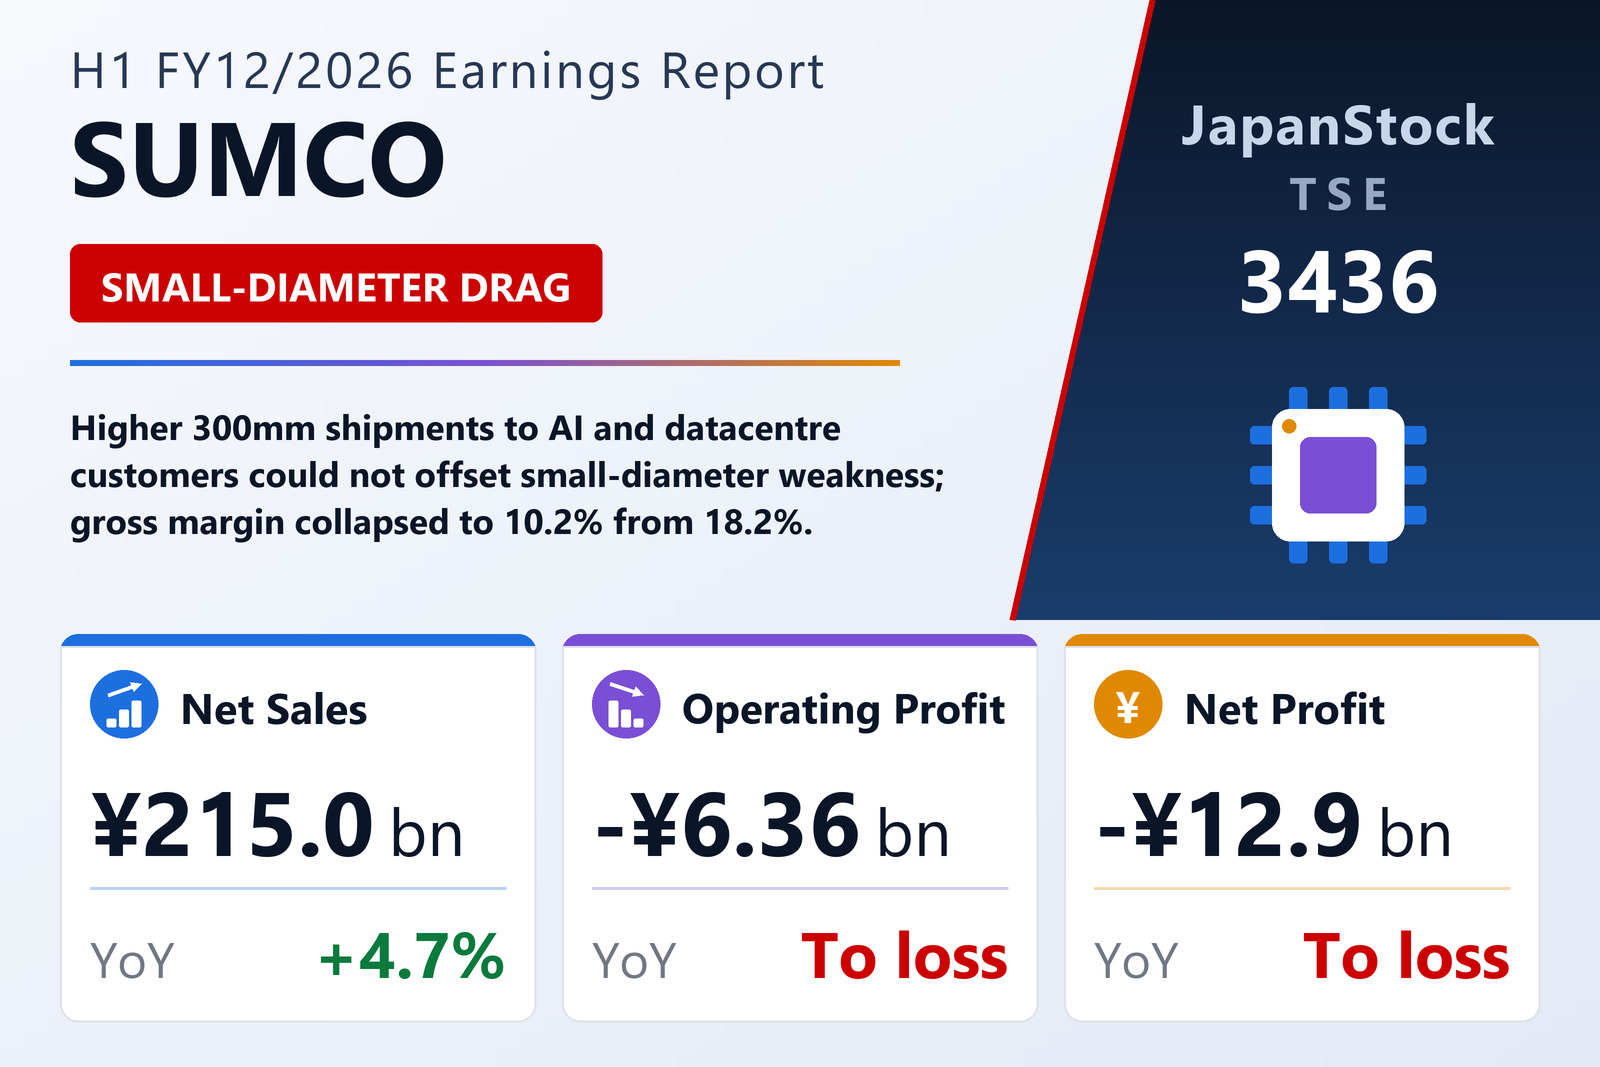
SUMCO Corporation (TSE: 3436) reported consolidated results under Japanese GAAP on August 6. This is an interim, six-month result covering January 1 to June 30, 2026 — SUMCO runs a December fiscal year-end, not the March year-end common among Japanese manufacturers, so these are half-year cumulative figures for FY12/2026 rather than a first quarter or a March-year result. Net sales rose 4.7% to ¥215,016 million, but the company swung to an operating loss of ¥6,363 million from a ¥7,457 million profit, an ordinary loss of ¥12,179 million from ¥4,720 million of ordinary profit, and a net loss attributable to owners of the parent of ¥12,895 million against a ¥3,081 million profit a year earlier. Loss per share was ¥36.87, against earnings of ¥8.81. As the world's number-two supplier of silicon wafers — the substrate on which essentially every semiconductor is built — SUMCO sits at the very front of the chip supply chain, and its results are a clean read on where the wafer cycle actually is rather than where chip prices are.
That distinction matters this half. Management's own description of the market is unambiguously constructive: semiconductor demand grew in volume terms led by AI, industrial applications that had lagged finally turned up, and in value terms the market grew strongly because memory prices rose. SUMCO's shipments followed. 300mm wafer shipments increased sharply on continued strong demand from advanced logic and memory used in AI and datacentre applications, and even 200mm-and-below shipments increased, albeit unevenly across customers and products. Yet revenue advanced only 4.7% and profitability fell apart. The wafer maker is shipping more silicon into the strongest chip cycle in years and losing money doing it — that is the story of this disclosure.
Cost of sales rose three times faster than revenue
The damage is concentrated in one line. Cost of sales climbed 14.9% to ¥193,083 million from ¥168,070 million — an increase of ¥25,013 million against a revenue gain of just ¥9,644 million. Gross profit therefore fell 41.2% to ¥21,933 million from ¥37,301 million, and the gross margin compressed to 10.2% from 18.2%, an eight-point deterioration in twelve months. The cost-of-sales ratio moved from 81.8% of revenue to 89.8%. Selling, general and administrative expenses were not the problem: SUMCO cut them 5.2% to ¥28,297 million from ¥29,844 million. But a ¥1,547 million saving in overheads could not begin to cover a ¥15,368 million hole in gross profit, and the operating line fell from a 3.6% margin to a negative 3.0%. The company says it pursued cost competitiveness including AI-assisted productivity improvement, and that it worked to hold its high share in advanced products by developing technology for customers' rising precision requirements and product differentiation. Both are true and neither was enough.
Two wafer markets moving in opposite directions
The reason the mix cannot rescue the margin is that SUMCO is running two structurally different businesses. In 300mm, demand from advanced logic and memory for AI and datacentre use stayed strong and shipments grew substantially — this is where SUMCO's high-specification, high-share product sits, and where the industry's leading-edge capacity is being absorbed by AI accelerators and the high-bandwidth memory stacked alongside them. In 200mm and below — the legacy diameters that serve analog, power, microcontroller and general industrial devices — the picture is described as mixed by customer and by product, with only a modest overall increase off a depressed base. SUMCO says it is reviewing and reorganising its production structure for the small-diameter business and continuing to work on efficiency and profitability there. A production structure under review is, in practice, a production structure partly idle, and that is exactly where the earnings leakage shows up below the operating line.
Idle-equipment depreciation nearly sextupled, and interest costs rose 37%
Between operating loss and ordinary loss, SUMCO lost another ¥5,816 million — and that gap is the most revealing set of numbers in the filing. Non-operating expenses rose to ¥7,039 million from ¥3,993 million. Within them, depreciation charged as a non-operating expense — the depreciation on suspended and idled production equipment — surged to ¥4,116 million from ¥698 million, close to a six-fold increase. That single line is the clearest quantification of the small-diameter restructuring: SUMCO is carrying the fixed cost of capacity it is not currently running, and it has grown by ¥3,418 million year on year. Interest expense rose 36.7% to ¥1,844 million from ¥1,349 million as Japanese funding costs followed policy rates higher on a borrowing book that also grew. Non-operating income, meanwhile, fell to ¥1,224 million from ¥3,304 million, with interest received slipping to ¥756 million from ¥890 million and other income dropping to ¥467 million from ¥2,413 million. There were no extraordinary items in either period, so pre-tax loss equals the ordinary loss at ¥12,179 million. A tax charge of ¥769 million was still booked despite the loss, taking the net loss to ¥12,949 million before ¥53 million of losses attributable to non-controlling interests.
The capex peak has passed: construction in progress halved
The balance sheet shows a company coming off a heavy investment cycle rather than entering one. Construction in progress fell 42.7% to ¥70,773 million from ¥123,432 million in six months, while machinery and transport equipment (net) rose to ¥326,342 million from ¥310,240 million as completed projects transferred into service. Buildings and structures edged down to ¥194,769 million from ¥198,044 million. Net of it all, total property, plant and equipment fell 6.0% to ¥623,743 million from ¥663,425 million — depreciation is now running well ahead of new spending. Total non-current assets declined to ¥659,662 million from ¥700,607 million. Management's stated plan is consistent with this: for 300mm it will advance the sophistication of existing manufacturing equipment to strengthen its ability to serve high-growth advanced-product demand, rather than announce a new greenfield build; for 200mm and below it will reorganise production. In other words, upgrade the leading edge and rationalise the tail — not expand both.
Cash builds, inventories creep up, and a weaker yen adds ¥5.3 billion to equity
Total assets rose 0.8% to ¥1,136,685 million from ¥1,127,966 million at the December 2025 year-end. Current assets grew to ¥477,022 million from ¥427,359 million, led by cash and deposits of ¥89,766 million (from ¥67,296 million) plus securities of ¥22,000 million (from ¥8,000 million) — a combined ¥111,766 million liquidity position against ¥75,296 million six months earlier. Trade receivables and contract assets rose to ¥94,565 million from ¥89,994 million. Inventories increased 3.7% to ¥259,884 million from ¥250,643 million, a build worth watching in a business where customer wafer inventories are only now normalising. On the other side, borrowings grew: short-term debt to ¥46,304 million from ¥41,253 million and long-term debt to ¥320,836 million from ¥312,200 million, taking total borrowings to ¥367,140 million — though because cash rose faster, net debt actually fell by roughly ¥22.8 billion. Net assets slipped 1.0% to ¥641,067 million and the equity ratio eased to 50.0% from 51.3%, with shareholders' equity excluding non-controlling interests at ¥568,156 million against ¥578,379 million. Currency worked in SUMCO's favour on the balance sheet: the foreign-currency translation adjustment contributed a positive ¥5,292 million to other comprehensive income, against a negative ¥2,469 million a year earlier, so total other comprehensive income of ¥6,163 million cut the comprehensive loss to ¥6,786 million — around half the net loss. Note that this interim tanshin contains no cash flow statement; the balance sheet, income statement and comprehensive income statement are the only financial statements presented.
Guidance implies a near-breakeven third quarter — and the year-end dividend is undecided
SUMCO discloses guidance only for the next cumulative quarter, on the stated grounds that its industry's operating environment changes too quickly for a reliable full-year forecast. For the nine months to September 30, 2026 it now guides to net sales of ¥333,000 million, up 9.4%, an operating loss of ¥6,300 million, an ordinary loss of ¥11,100 million and a net loss of ¥12,800 million (¥36.60 per share). Because this is the first Q3 forecast the company has published, it is flagged as a revision from prior guidance while having no numeric predecessor. What it implies for the July–September quarter alone is more interesting than the cumulative figures: revenue of about ¥117,984 million, up roughly 19% on the ¥99,064 million recorded in the same quarter last year, with the operating line back to roughly breakeven (a ¥63 million profit) and ordinary profit of about ¥1,079 million — versus ordinary and operating losses in the year-ago third quarter. Management expects 300mm to benefit from strong AI-related advanced logic and DRAM demand plus growing NAND demand as server SSD capacity expands, with customer wafer inventory normalisation progressing and overall 300mm supply-demand improving; 200mm and below is assumed to recover only gradually. The forecast assumes ¥160 to the US dollar for July–September. On risk, SUMCO says the Middle East situation has had no impact on its operations to date but that it is concerned about the effect on procurement costs for electricity and materials, and that it continues to monitor geopolitical risk and national policy — particularly the impact on demand for the end products that carry semiconductors. On the dividend, SUMCO confirmed an interim payment of ¥10.00 per share, unchanged from a year earlier, payable from September 3, 2026; the year-end dividend is undecided and will be disclosed once determinable, so no full-year figure is given against the ¥20.00 paid for FY12/2025. There were no subsequent events and no going-concern issues; the only note on equity movement records the delivery of 19,900 shares from the performance-linked share compensation trust, reducing treasury stock by ¥39 million to ¥875 million. Shares issued stood at 350,175,139 with 442,825 held in treasury.
| Metric | H1 FY12/2026 | H1 FY12/2025 | YoY |
|---|---|---|---|
| Net sales (¥ million) | 215,016 | 205,372 | +4.7% |
| Cost of sales (¥ million) | 193,083 | 168,070 | +14.9% |
| Gross profit (¥ million) | 21,933 | 37,301 | −41.2% |
| Gross margin | 10.2% | 18.2% | −8.0 pt |
| SG&A expenses (¥ million) | 28,297 | 29,844 | −5.2% |
| Operating profit / loss (¥ million) | −6,363 | 7,457 | To loss |
| Ordinary profit / loss (¥ million) | −12,179 | 4,720 | To loss |
| Net profit / loss attrib. to owners (¥ million) | −12,895 | 3,081 | To loss |
| Earnings / loss per share (¥) | −36.87 | 8.81 | To loss |
| Comprehensive income (¥ million) | −6,786 | 2,059 | To loss |
| Idle-equipment depreciation, non-operating (¥ million) | 4,116 | 698 | +489.7% |
| Total assets (¥ million, vs Dec 31, 2025) | 1,136,685 | 1,127,966 | +0.8% |
| Net assets (¥ million, vs Dec 31, 2025) | 641,067 | 647,785 | −1.0% |
| Equity ratio | 50.0% | 51.3% | −1.3 pt |
| Metric | 9M FY12/2026 forecast | 9M FY12/2025 actual | YoY | Implied Q3 (Jul–Sep) |
|---|---|---|---|---|
| Net sales (¥ million) | 333,000 | 304,436 | +9.4% | 117,984 |
| Operating profit / loss (¥ million) | −6,300 | 5,869 | To loss | 63 |
| Ordinary profit / loss (¥ million) | −11,100 | 2,175 | To loss | 1,079 |
| Net profit / loss attrib. to owners (¥ million) | −12,800 | −995 | Loss widened | 95 |
| Earnings / loss per share (¥) | −36.60 | −2.85 | Loss widened | — |
| FX assumption (¥ / US$, Jul–Sep) | 160.00 | — | — | — |
| Interim dividend per share (¥) | 10.00 | 10.00 | Unchanged | — |
| Year-end dividend per share (¥) | Undecided | 10.00 | — | — |
JapanStockPulse provides informational content only and does not constitute investment advice. Figures are taken from the company's published earnings short report and may be subject to subsequent revision. Implied third-quarter figures are calculated by JapanStockPulse as the difference between the company's nine-month guidance and its reported first-half results.