Revenue rose 57%, cost of sales 25% — and that gap is the half
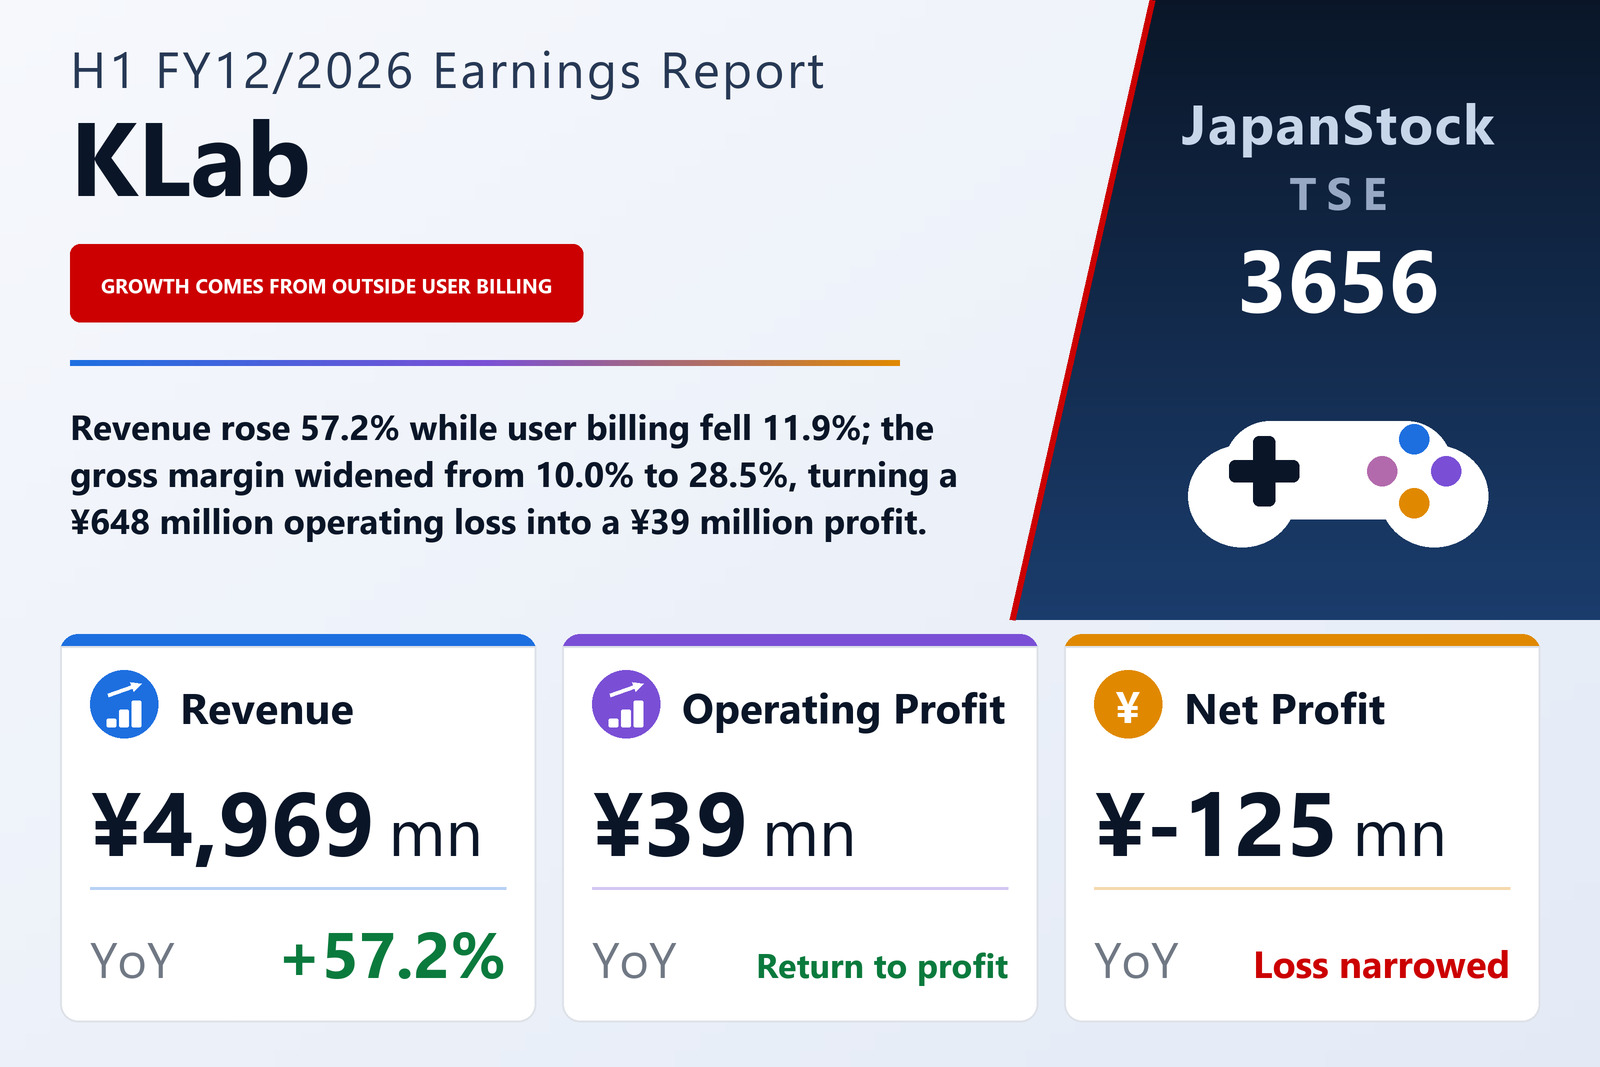
KLab Inc. (TSE: 3656), the Japanese mobile-game developer whose single reporting segment is its game business, published consolidated interim results for the six months from January 1 to June 30, 2026 on August 6, 2026 under Japanese GAAP. Revenue rose 57.2% to ¥4,969 million from ¥3,161 million, and the company swung from an operating loss of ¥648 million to an operating profit of ¥39 million. Below that line it remained loss-making: the ordinary loss narrowed to ¥95 million from ¥830 million and the loss attributable to owners of the parent to ¥125 million from ¥4,748 million, for a loss of ¥1.58 per share against ¥90.96. The filing states the listing as the Tokyo Stock Exchange and names no market segment.
The arithmetic between revenue and the operating line is the whole of the half. Cost of sales rose 24.9% to ¥3,552 million against revenue growth of 57.2% — a gap of more than thirty percentage points. Gross profit therefore rose 347.6% to ¥1,416 million from ¥316 million, and the gross margin widened from 10.0% to 28.5%. Selling, general and administrative expenses grew 42.8% to ¥1,376 million, far slower than gross profit but far faster than cost of sales, and they consumed almost all of what the gross line produced: the operating profit that survived was ¥39 million, an operating margin of 0.8%. The swing into the black is real, but it is thin — ¥39 million on ¥4,969 million of revenue.
A crypto-asset writedown put the result back into the red below the operating line
Non-operating items turned that operating profit back into a loss. Non-operating income was ¥75 million against ¥50 million, helped by a foreign-exchange gain of ¥61 million where the prior half had none, and by interest income of ¥8 million. Non-operating expenses were ¥210 million against ¥232 million, but their composition changed entirely: the largest item this year was a ¥192 million valuation loss on crypto-assets, which did not appear at all a year earlier, while the prior half's largest item — a ¥118 million foreign-exchange loss — reversed into this half's gain. Interest expense fell to ¥2 million from ¥25 million. The net non-operating charge of ¥135 million is what turned a ¥39 million operating profit into an ordinary loss of ¥95 million.
The 97% collapse in the net loss is last year's impairment leaving the base
Almost all of the improvement at the bottom line is the disappearance of a single prior-year charge. In the first half of 2025 KLab booked extraordinary losses of ¥4,469 million, of which ¥4,426 million was an impairment of software in progress in the game segment, partly offset by extraordinary gains of ¥621 million from the sale of investment securities. This half it booked no extraordinary losses at all, and extraordinary gains of less than ¥1 million. The pre-tax loss was accordingly ¥95 million against ¥4,678 million, and income taxes — computed, as the notes state, by applying an estimated full-year effective tax rate to the interim pre-tax result — were ¥30 million against ¥70 million. The loss attributable to owners of the parent came out at ¥125 million against ¥4,748 million, down 97.4%, and comprehensive loss at ¥236 million against ¥4,889 million.
The loss per share fell further still, by 98.3%, to ¥1.58 from ¥90.96, because the share count rose at the same time. Average shares outstanding for the half were 79,703,553 against 52,206,093, up 52.7%, and shares issued reached 83,792,600 at June 30, 2026 from 76,832,200 at the December year-end, the increase coming from exercises of share acquisition rights. Treasury shares were unchanged at 641,617. A reader comparing the two per-share figures is therefore comparing two different denominators as well as two different losses.
Revenue grew, but not from players
The segment note splits revenue into billing and everything else, and the two moved in opposite directions. Revenue from user billing fell 11.9%, to ¥2,163 million from ¥2,457 million. All other revenue rose almost fourfold, to ¥2,805 million from ¥704 million. Group revenue grew by ¥1,807 million in total; other revenue grew by ¥2,101 million while user billing shrank by ¥293 million. The half's entire revenue increase, and more, therefore came from outside the in-game monetisation that the billing line measures — and the filing does not say what that other revenue consists of.
One reporting segment that earns, and an "other" that does not
KLab reports a single segment, the game business, with everything else grouped as "Other". Game revenue rose 44.3% to ¥4,551 million and game segment profit 415.2% to ¥1,614 million. The "Other" grouping, which is not a reportable segment, produced revenue of ¥417 million against ¥6 million — a base so small that a growth rate carries no meaning — but a segment loss of ¥197 million against a ¥3 million profit. There were no intersegment sales or transfers in either period, so each segment's external revenue and its total are the same figure.
One detail matters for reading those profit lines: the company states that segment profit equals consolidated gross profit, and makes no reconciling adjustment. The ¥1,614 million and −¥197 million are therefore gross-profit figures rather than operating ones, and group selling, general and administrative expenses of ¥1,376 million sit below them, unallocated. On that basis the game business produced ¥1,614 million of gross profit, the "Other" activities consumed ¥197 million of it, and what survived SG&A was the ¥39 million operating profit.
Equity rose on warrant exercises while cash fell 30%
Total assets rose 10.3% to ¥14,637 million from ¥13,273 million at December 31, 2025, and net assets 13.6% to ¥11,706 million, of which shareholders' equity was ¥11,427 million against ¥10,201 million. The equity ratio rose from 76.9% to 78.1%. Total liabilities edged down 1.3% to ¥2,930 million, so the balance-sheet growth is equity and not borrowing: capital stock and capital surplus each rose by ¥731 million on exercises of share acquisition rights, taking capital stock to ¥9,345 million and capital surplus to ¥9,099 million, while the accumulated deficit widened to ¥6,084 million from ¥5,959 million as the half's loss was added to it.
Within assets the movements are larger than the totals suggest. Cash and deposits fell 30.0%, to ¥3,649 million from ¥5,214 million, while trade receivables more than doubled, to ¥2,453 million from ¥1,151 million — an increase of ¥1,301 million in amounts billed but not yet collected. In intangibles, software rose to ¥2,583 million from ¥12 million while software in progress fell to ¥1,120 million from ¥3,150 million, which reads as capitalised development moving into service rather than as new spending; total intangible assets rose 16.9% to ¥3,704 million. This interim tanshin contains no cash-flow statement, so the cash movement cannot be attributed to operating, investing or financing activity from the document itself.
Guidance is unchanged, and leaves 96% of the year's operating profit in the second half
The full-year FY12/2026 forecast was not revised. KLab expects revenue of ¥17,000 million, up 147.9%, and operating profit of ¥1,000 million; the guidance table prints the operating-profit percentage as a dash, and prints dashes for ordinary profit, for profit attributable to owners of the parent and for earnings per share, so the company publishes no full-year figure for those three lines at all. Against the revenue target the first half delivered 29.2%, and against the operating-profit target about 4%. The implied second half is therefore ¥12,031 million of revenue and ¥961 million of operating profit — roughly 2.4 times the first half's revenue and about 24 times its operating profit. The filing offers no explanation of that shape.
No dividend was paid for FY12/2025 and none is forecast for FY12/2026: the dividend table shows ¥0.00 at every point in both years, the forecast was not revised, and the payment start date is printed as a dash. Two points about the document itself are worth stating plainly. It carries no management discussion of results — the attachments run to the balance sheet, the income and comprehensive income statements, the notes and the segment note, and the company refers readers to presentation materials on its website — so the causes of the 57.2% revenue rise, of the fall in user billing and of the crypto-asset writedown are nowhere explained in the filing. And, as the tanshin itself notes, a second-quarter report is not subject to review by a certified public accountant or an audit firm.
| Metric | H1 FY12/2026 | H1 FY12/2025 | Change |
|---|---|---|---|
| Revenue (¥ million) | 4,969 | 3,161 | +57.2% |
| Revenue from user billing (¥ million) | 2,163 | 2,457 | −11.9% |
| Other revenue (¥ million) | 2,805 | 704 | +298.4% |
| Gross profit (¥ million) | 1,416 | 316 | +347.6% |
| Gross margin | 28.5% | 10.0% | +18.5 pt |
| SG&A expenses (¥ million) | 1,376 | 964 | +42.8% |
| Operating profit (¥ million) | 39 | −648 | loss to profit |
| Ordinary profit (¥ million) | −95 | −830 | loss narrowed |
| Net profit attrib. to owners of parent (¥ million) | −125 | −4,748 | loss narrowed |
| EPS (¥) | −1.58 | −90.96 | loss narrowed |
| Game — revenue (¥ million) | 4,551 | 3,155 | +44.3% |
| Game — segment profit (¥ million) | 1,614 | 313 | +415.2% |
| Other — revenue (¥ million) | 417 | 6 | n.m. |
| Other — segment profit (¥ million) | −197 | 3 | profit to loss |
| Total assets (¥ million) | 14,637 | 13,273 | +10.3% |
| Net assets (¥ million) | 11,706 | 10,304 | +13.6% |
| Equity ratio | 78.1% | 76.9% | +1.2 pt |
| FY12/2026 guidance — revenue (¥ million) | 17,000 | — | +147.9% |
| FY12/2026 guidance — operating profit (¥ million) | 1,000 | — | — |
| FY12/2026 guidance — ordinary profit (¥ million) | — | — | — |
| FY12/2026 guidance — net profit (¥ million) | — | — | — |
| Annual dividend per share (¥) | 0.00 | 0.00 | unchanged |
JapanStockPulse provides informational content only and does not constitute investment advice. Figures are taken from the company's published earnings short report and may be subject to subsequent revision.