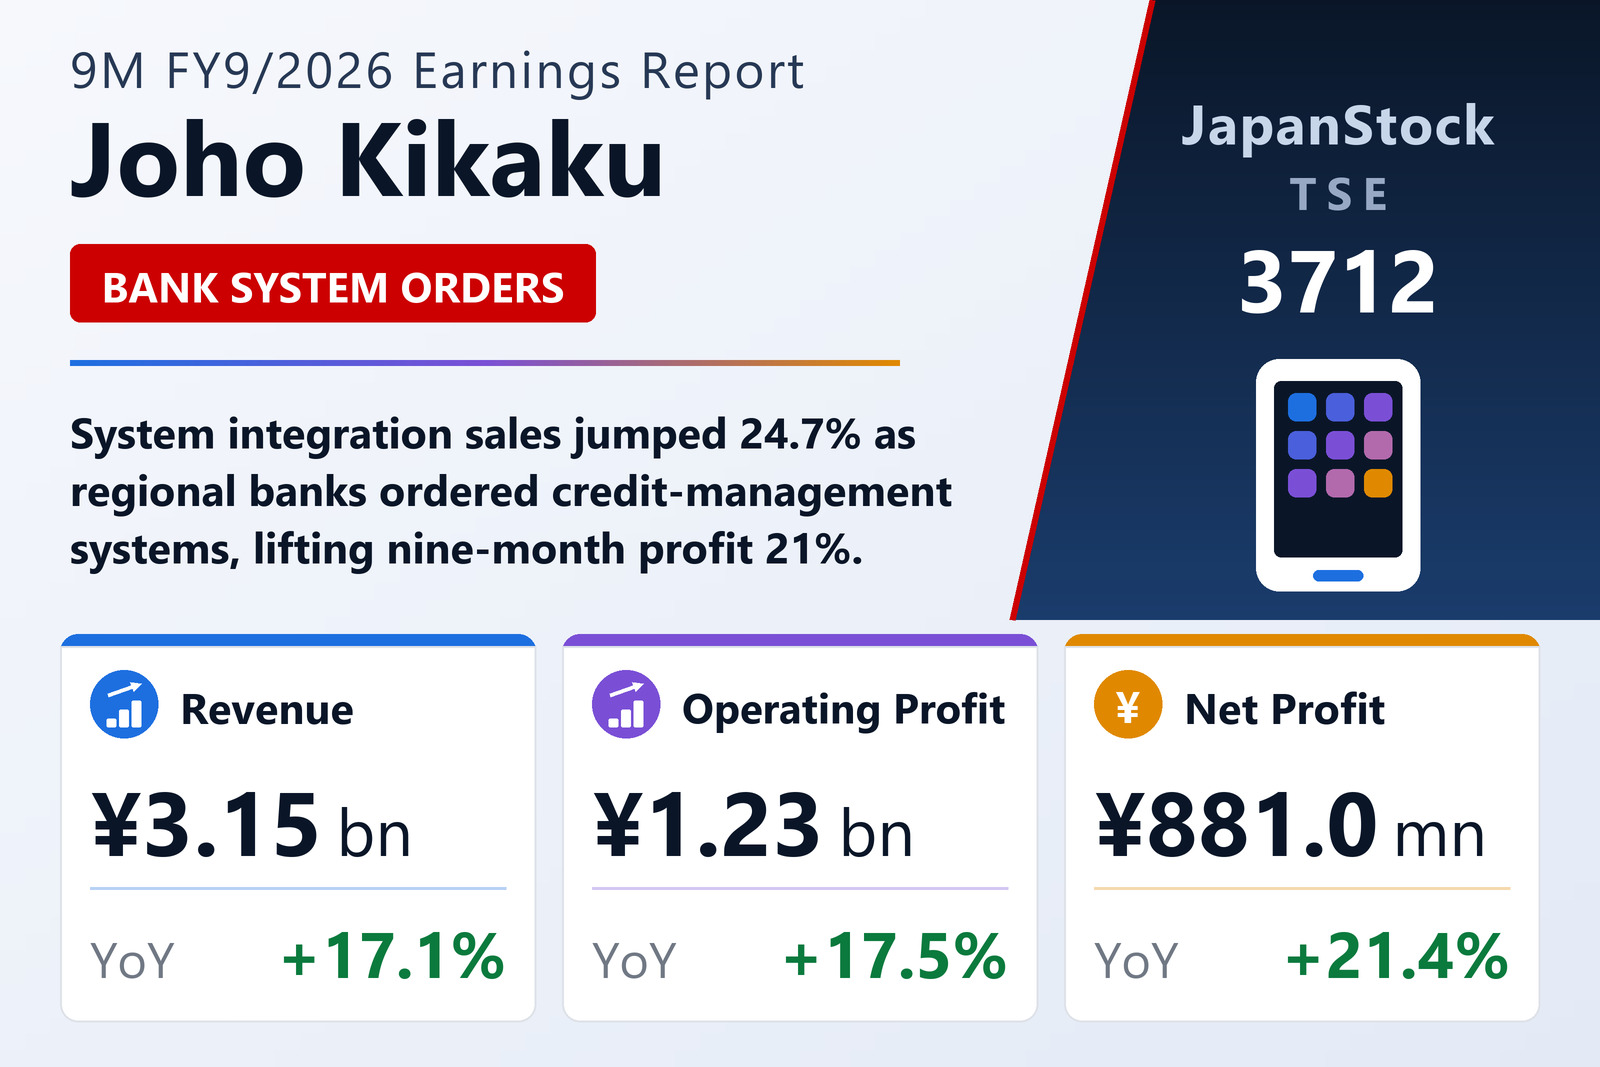
Joho Kikaku Co., Ltd. (TSE: 3712) reported consolidated results under Japanese GAAP on August 6. These are nine-month cumulative figures covering October 1, 2025 to June 30, 2026 — the company runs a September fiscal year-end, not the March year-end common to most Japanese listed companies and not a December one, so this is the third-quarter cumulative statement of FY9/2026 rather than a first-half or calendar-year report. Revenue rose 17.1% to ¥3,147 million, operating profit 17.5% to ¥1,228 million, ordinary profit 18.0% to ¥1,235 million, and net profit attributable to owners of the parent 21.4% to ¥881 million. Earnings per share came to ¥58.22 against ¥47.95 a year earlier, both restated for a five-for-one stock split that took effect on April 1, 2026. The financial statements were not subject to audit or review, and the company published no supplementary presentation materials and held no earnings briefing.
What stands out in the numbers is how little the profit mix changed while the top line accelerated. The operating margin was 39.0% against 38.9% a year earlier — an unusually high level for a Japanese systems integrator, and one the company held even as the revenue base expanded by more than a sixth. The gross margin actually fell, to 63.4% from 66.9%, as cost of sales climbed 29.1% to ¥1,151 million on heavier project delivery. That was offset almost exactly below the gross line: selling, general and administrative expenses rose only 2.1% to ¥769 million, so the SG&A ratio dropped to 24.4% of revenue from 28.0%. In other words, the incremental revenue was won at a lower gross margin but absorbed almost no additional overhead.
System integration jumps 24.7% as banks renew credit platforms
The System business — which the company splits into a System Integration division that builds and installs software and a System Support division that maintains it — produced revenue of ¥2,946 million, up 17.5%, and segment profit of ¥1,187 million, up 18.0%, a 40.3% segment margin. Growth was concentrated in the integration half, where revenue rose 24.7% to ¥1,815 million and which now accounts for 61.6% of System business sales.
All four of the company's core products contributed. The collateral real-estate valuation management system, its flagship, saw firm order flow from major financial institutions and regional banks. The comprehensive financial-statement reading system, which automates the analysis of borrower accounts, grew on a rising number of renewal projects at regional banks and large shinkin credit unions. The self-assessment support system — used by lenders to classify and grade their own loan books — recorded a sharp increase after the company won mandates from the JA agricultural cooperative group, an adjacent customer pool to its traditional bank base. And the loan approval workflow support system also grew steeply on multiple orders from large shinkin credit unions. The pattern across all four is the same: renewal and replacement cycles at second-tier lenders, rather than a single large win.
Maintenance revenue is the quieter half — and the more durable one
The System Support division, which carries the recurring maintenance contracts attached to installed systems, grew a comparatively modest 7.6% to ¥1,131 million, or 38.4% of System business revenue. Management attributed the increase directly to the cumulative effect of more systems going live. That relationship matters for how the current growth spurt should be read: integration revenue is project-based and lumpy, but each completed installation adds to a maintenance base that recurs in later periods. The 7.6% growth in support is therefore a lagging, and smoother, read on the same order flow that produced the 24.7% integration jump — and it is the line that will still be there once a project cycle turns.
Rate rises have made bank IT budgets a tailwind
The backdrop the company describes is favourable and specific. Its principal customers are financial institutions, which have been raising lending rates in response to the Bank of Japan's policy-rate increases. Management said business conditions at those customers are currently strong and that its own order activity is progressing smoothly, while flagging one watch item: concern that higher prices and labour shortages could push up bankruptcies among borrowers. For the remainder of the year, the company said financial institutions' appetite for system investment remains high and that it expects demand for both new installations and renewals to increase, while noting rising global uncertainty including the situation in the Middle East. The rate cycle showed up in the accounts too, if only faintly: non-operating income rose to ¥7 million from ¥2 million as interest income nearly tripled to ¥4.0 million from ¥1.4 million and a new ¥2.8 million of subsidy income was booked.
A second segment in property, and a balance sheet with 84.4% equity
Alongside software, Joho Kikaku runs a real-estate leasing business holding nine properties — five rental apartment buildings, one multi-storey car park, one rental office building and two rental retail units. It generated revenue of ¥201 million, up 10.5%, and segment profit of ¥41 million, up 5.9%: about 6% of group revenue and 3% of segment profit, small but consistently profitable.
Total assets stood at ¥8,854 million at June 30, up ¥438 million from the September 2025 year-end. The largest movements were a ¥427 million increase in buildings and structures — capital spending well ahead of the ¥93 million of depreciation charged in the period — and a ¥166 million rise in cash and deposits to ¥3,014 million, partly offset by a ¥177 million fall in accounts receivable and contract assets. Total liabilities fell ¥80 million to ¥1,384 million, mainly on lower income taxes payable, which dropped to ¥127 million from ¥273 million. Net assets rose ¥517 million to ¥7,469 million, driven almost entirely by retained earnings, lifting the equity ratio to 84.4% from 82.6%. With cash of ¥3,014 million against total liabilities of ¥1,384 million and no meaningful borrowings, the balance sheet is heavily net cash. Note that no cash flow statement is prepared for the third quarter; the company disclosed only depreciation of ¥93 million (against ¥76 million), goodwill amortisation of ¥9 million and customer-related asset amortisation of ¥1 million. Remaining goodwill was ¥39 million.
Below the operating line, an extraordinary gain on sale of fixed assets of ¥45 million — with no comparable item a year earlier — lifted pre-tax profit 22.3% to ¥1,280 million, running ahead of the 18.0% growth in ordinary profit. That gain is the main reason net profit growth (21.4%) outpaced operating profit growth (17.5%), and it is not a recurring item.
Guidance unchanged, implying a much softer fourth quarter
Full-year guidance for FY9/2026 was left unrevised: revenue of ¥4,100 million (up 6.7%), operating profit of ¥1,540 million (up 0.2%), ordinary profit of ¥1,540 million (up 0.1%) and net profit of ¥1,100 million (up 2.1%), for EPS of ¥72.73 on the post-split share count (¥363.65 before the split). Against those targets the nine months represent 76.8% of the revenue forecast, 79.7% of operating profit, 80.2% of ordinary profit and 80.0% of net profit — comfortably ahead of a straight-line 75% pace on every line.
The arithmetic of the remaining quarter is therefore worth spelling out. Holding guidance implies fourth-quarter revenue of roughly ¥953 million and operating profit of about ¥312 million, well below the ¥1,153 million and ¥492 million that the same guidance implies were earned in the fourth quarter of FY9/2025. Either the company is being deliberately conservative about a project-timing-driven business, or the exceptional integration momentum of the first nine months is expected to normalise sharply. Management gave no indication of a revision, and the guidance carries the standard caveat that it is based on information currently available and is not a commitment.
Dividend and share split
The company completed a five-for-one common share split on April 1, 2026, and the resulting presentation requires care. The FY9/2026 interim dividend of ¥60.00 was declared on the pre-split share count; the forecast year-end dividend of ¥12.00 is stated on the post-split count, so the two cannot be added and the company reports the annual total as "—". On a consistent pre-split basis the forecast year-end dividend is ¥60 and the annual total ¥120, against ¥115 for FY9/2025 (¥55 interim plus ¥60 year-end) — a ¥5 increase. That equates to a payout ratio of about 33% of the pre-split EPS forecast of ¥363.65. The dividend forecast is unchanged from the previous announcement, and no payment start date has been set.
Shares issued were unchanged at 20,450,000 on a post-split basis, with treasury shares of 5,325,420 — a substantial 26.0% of issued capital — and an average of 15,124,586 shares outstanding during the period. There were no changes to the scope of consolidation, no changes in accounting policies or estimates, no restatements, no going-concern note, no significant change in shareholders' equity, and no material subsequent events were disclosed.
| Metric | 9M FY9/2026 | 9M FY9/2025 | YoY |
|---|---|---|---|
| Revenue (¥ million) | 3,147 | 2,689 | +17.1% |
| Gross profit (¥ million) | 1,997 | 1,798 | +11.1% |
| SG&A expenses (¥ million) | 769 | 753 | +2.1% |
| Operating profit (¥ million) | 1,228 | 1,045 | +17.5% |
| Operating margin | 39.0% | 38.9% | +0.1pp |
| Ordinary profit (¥ million) | 1,235 | 1,047 | +18.0% |
| Profit before tax (¥ million) | 1,280 | 1,047 | +22.3% |
| Net profit attrib. to owners (¥ million) | 881 | 725 | +21.4% |
| EPS (¥, post-split basis) | 58.22 | 47.95 | +21.4% |
| Total assets (¥ million, vs Sep 30, 2025) | 8,854 | 8,416 | +5.2% |
| Net assets (¥ million, vs Sep 30, 2025) | 7,469 | 6,952 | +7.4% |
| Equity ratio | 84.4% | 82.6% | +1.8pp |
| Division / segment | 9M FY9/2026 | 9M FY9/2025 | YoY |
|---|---|---|---|
| System Integration revenue | 1,815 | 1,455 | +24.7% |
| System Support (maintenance) revenue | 1,131 | 1,052 | +7.6% |
| System business revenue | 2,946 | 2,507 | +17.5% |
| System business segment profit | 1,187 | 1,006 | +18.0% |
| Real estate leasing revenue | 201 | 182 | +10.5% |
| Real estate leasing segment profit | 41 | 39 | +5.9% |
| Consolidated revenue | 3,147 | 2,689 | +17.1% |
| Consolidated operating profit | 1,228 | 1,045 | +17.5% |
JapanStockPulse provides informational content only and does not constitute investment advice. Figures are taken from the company's published earnings short report and may be subject to subsequent revision.