Growth arrived at the lowest-margin end of the business
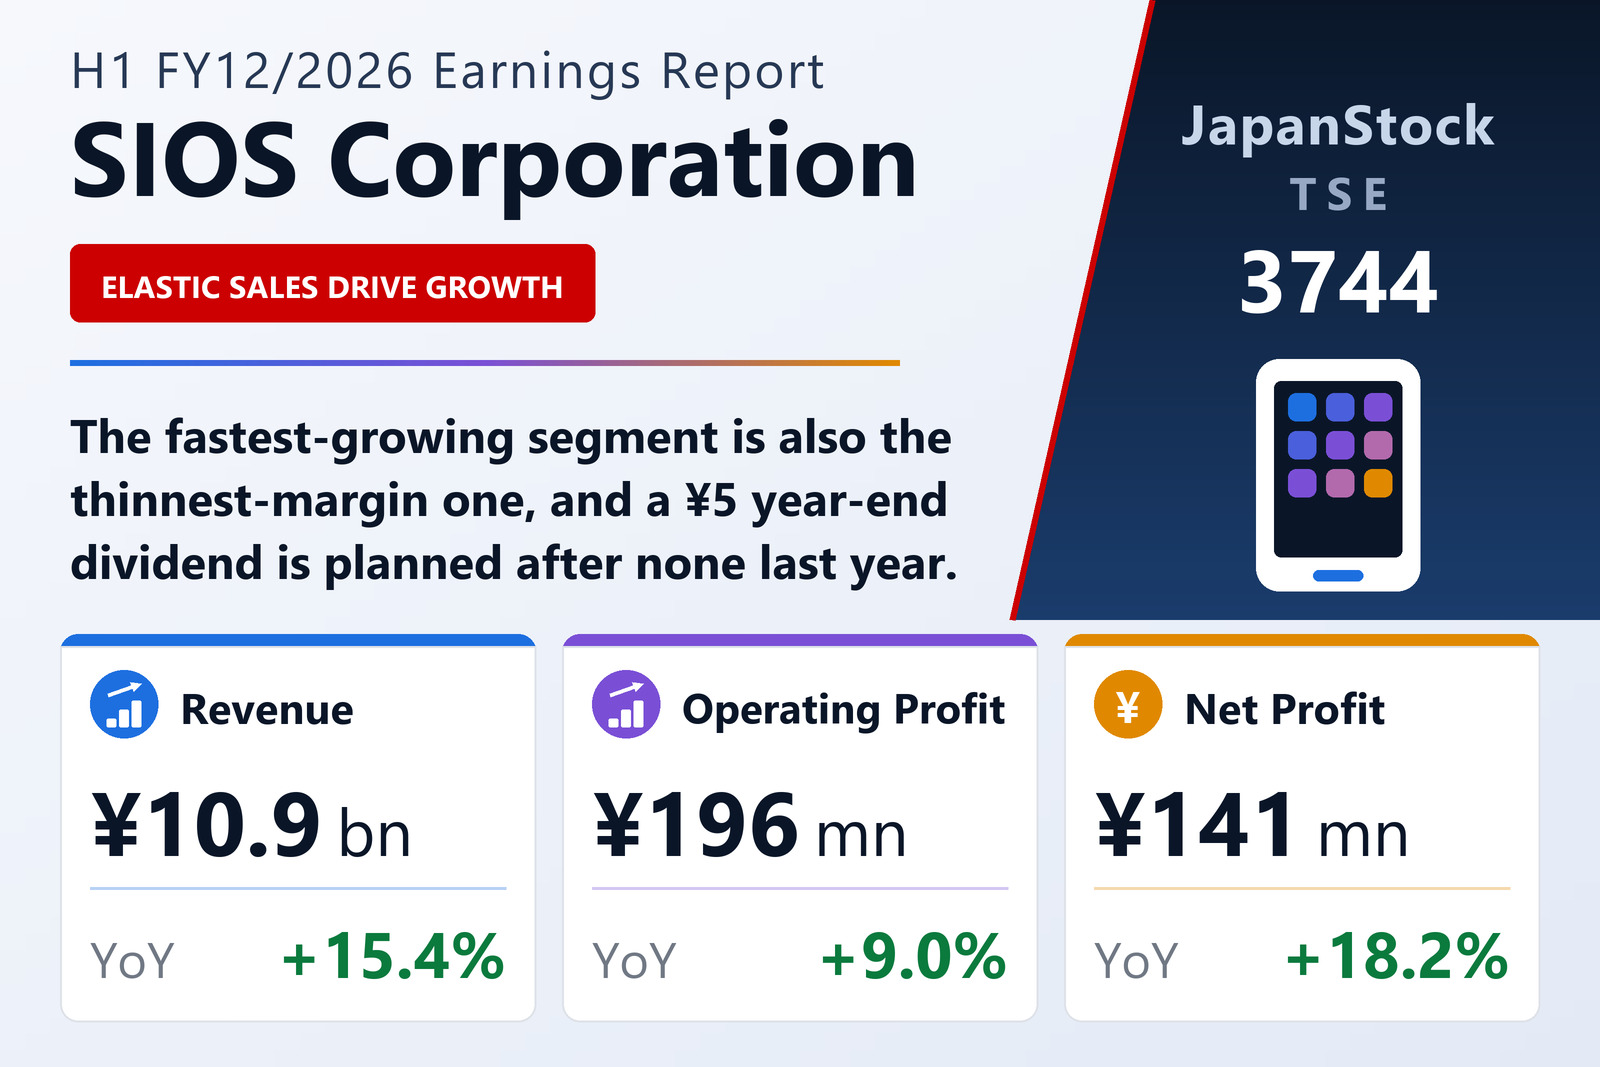
SIOS Corporation (TSE: 3744), the Tokyo-based open-source software group behind the LifeKeeper high-availability platform and the Gluegent family of cloud services, published consolidated interim results for the six months to June 30, 2026 under Japanese GAAP on August 6, 2026. Revenue rose 15.4% to ¥10,944 million from ¥9,486 million — a sharp reversal from the 19.6% decline the same half posted a year earlier. Operating profit rose only 9.0%, to ¥196 million from ¥179 million.
The distance between those two growth rates is the whole story of the half, and it is visible one line above operating profit. Cost of sales rose 18.7%, to ¥8,197 million from ¥6,905 million — faster than revenue. Gross profit therefore grew just 6.4%, to ¥2,747 million from ¥2,581 million, and the gross margin narrowed to 25.1% from 27.2%, a loss of 2.1 percentage points. Selling, general and administrative expenses rose 6.2%, to ¥2,550 million from ¥2,401 million — marginally slower than gross profit, which is the only reason operating profit outgrew the gross line at all. The operating margin finished at 1.79%, down from 1.90%.
That is an unusually thin margin to be defending, and it matters because the revenue that arrived defends it less well than the revenue already there. On these figures roughly ¥1.79 of every ¥100 sold reaches the operating line; a year ago it was ¥1.90.
Segment mix — and the corporate overhead that took two-thirds of the gain
One caveat before comparing the three reportable segments. SIOS redrew its reporting boundaries this period: part of the business previously inside Product & Service was moved into Software Sales & Solution so that management units match the form of the transaction, in support of the growth strategy from this fiscal year onward. Prior-year segment figures have been restated on the new basis, so the year-on-year comparisons below are like-for-like.
Product & Service, the in-house product business, produced revenue of ¥2,483 million, up 5.0%, and segment profit of ¥314 million, up 10.3% — a segment margin of 12.7% against 12.0%. Consulting & Integration produced ¥1,687 million, down 3.5%, and ¥210 million, down 1.5%, for a margin of 12.4%. Software Sales & Solution produced ¥6,773 million, up 26.1%, and ¥92 million, up 27.3% — a margin of 1.4%.
Set those side by side and the arithmetic is unambiguous. Software Sales & Solution supplied ¥1,402 million of the group's ¥1,458 million revenue increase — 96% of it — at roughly one-ninth of the margin the in-house product business earns. Its share of external revenue rose to 61.9% from 56.6%, while Product & Service fell to 22.7% from 24.9% and Consulting & Integration to 15.4% from 18.4%. A company can grow this way. It cannot widen its margin this way.
The three segments together earned ¥617 million, up ¥46 million or 8.1%. Only ¥16 million of that reached operating profit, because unallocated corporate costs — the parent's administrative functions — rose to ¥414 million from ¥384 million, absorbing ¥30 million, or roughly two-thirds of the segment-level gain. The remainder of the reconciliation is ¥7 million of intersegment elimination and ¥300 thousand of incidental administrative-division revenue that sits outside the reportable segments.
Geographically the group remains almost entirely domestic. Japan supplied ¥10,521 million, or 96.1% of revenue, up 15.7%. The Americas fell 3.3% to ¥229 million, Europe rose 17.7% to ¥122 million, and other regions rose 34.0% to ¥73 million. Whatever is driving the Elastic business, it is being sold in Japan.
What the revenue-recognition split says about the subscription shift
SIOS says it is expanding a "stock-type" — recurring — business model. The revenue-recognition disclosure lets that claim be tested, and the answer is mixed.
Revenue transferred at a point in time rose 24.1%, to ¥6,853 million from ¥5,522 million. Revenue transferred over time — the recurring base — rose only 3.2%, to ¥4,092 million from ¥3,964 million. The over-time share of the total therefore fell, to 37.4% from 41.8%. At group level the recurring share went backwards, and it did so not because recurring revenue shrank but because point-in-time reselling grew eight times faster.
Inside the segments the picture is more encouraging, and it runs the other way. Within Product & Service, point-in-time revenue fell 10.9% to ¥476 million while over-time revenue rose 9.6% to ¥2,007 million — which is precisely what a shift of MFP document-management software from licence sales to subscription looks like while it is happening. Those are the Quick Scan and Speedoc products that run on multifunction peripherals combining printer, scanner, copier and fax; management describes the migration to a subscription model as being in full swing and says it temporarily depressed revenue in the period, with other in-house products more than making up the difference.
Two of those products are named. LifeKeeper — the failover software that keeps a duplicate standby server ready to take over a production workload automatically if the live one fails — grew both revenue and profit on steady deal wins. The Gluegent series, comprising the Gluegent Flow cloud workflow tool, the Gluegent Gate cloud identity-management service and the Gluegent Apps group scheduler built on Google Calendar, also grew both, having largely completed a migration to a new price plan that bundles generative-AI features as standard, alongside growth in user numbers.
In Software Sales & Solution the mix moved in the opposite direction: point-in-time revenue jumped 29.8% to ¥6,199 million while over-time revenue fell 3.4% to ¥574 million. The growth is Elastic N.V. products — offerings built on Elasticsearch, the open-source high-speed search and analytics engine, including a consulting service for building retrieval-augmented generation systems that raise the accuracy of generative-AI output. The demand is real and the product is topical; the economics are those of a reseller.
Consulting & Integration shrank on both measures — point-in-time down 15.9% to ¥177 million, over-time down 1.8% to ¥1,511 million. Education-sector system development and build support, and generative-AI implementation support, both won work steadily; other businesses fell against a prior-year comparison that management describes as unusually strong.
Below the operating line: the same contribution, assembled differently
Ordinary profit rose 8.2% to ¥239 million from ¥221 million. The net non-operating contribution was almost unchanged — ¥44 million against ¥42 million — but almost nothing inside it was the same. A year ago the group booked a ¥66 million foreign-exchange gain against a ¥57 million derivative valuation loss. This half it booked a ¥19 million exchange loss against a ¥6 million derivative valuation gain. What replaced the difference was ¥25 million of penalty income, which did not exist a year ago, and interest income of ¥19 million, up 45% from ¥13 million on a larger cash balance. Non-operating income totalled ¥64 million against ¥100 million; non-operating expenses ¥20 million against ¥58 million.
One detail is worth flagging against the company's own summary, which attributes the ordinary-profit gain to interest income and share of profit of equity-method affiliates. Interest income did rise. Equity-method income fell, to ¥8 million from ¥11 million.
Extraordinary items appeared where last year there were none: a ¥0.5 million gain on the sale of investment securities, against ¥1.7 million of losses on retirement of fixed assets and a ¥4.9 million loss on the termination of a retirement benefit plan. Pre-tax profit was therefore ¥233 million, up just 5.4% — the slowest growth anywhere in the cascade, and less than a third of the revenue growth rate.
Net profit attributable to owners of parent nevertheless rose 18.2% to ¥141 million, and the reason is tax. The total charge was ¥92 million against ¥102 million, an effective rate of 39.6% against 46.1%. Current tax actually rose sharply, to ¥116 million from ¥69 million, but a deferred tax credit of ¥24 million — where the prior year carried a ¥32 million deferred charge — more than offset it. Earnings per share were ¥16.28 against ¥13.77, on a weighted average of 8,669,062 shares barely changed from 8,668,843; there are no potential dilutive shares. Comprehensive income was ¥148 million, up 53.7% from ¥96 million, the extra gap to net profit coming from ¥7 million of positive currency translation where a year earlier translation cost ¥14 million.
Contract liabilities drove a ¥548 million swing in operating cash flow
The balance sheet carries the clearest evidence that the subscription shift is real rather than rhetorical.
Contract liabilities — customer cash collected against services not yet recognised as revenue — rose ¥569 million, or 14.4%, to ¥4,522 million from ¥3,952 million at December 31, 2025. That single line is the largest mover on the statement and is what pushed current liabilities up 9.7% to ¥7,027 million. It is also why cash and deposits rose ¥561 million to ¥4,148 million, lifting current assets 10.8% to ¥8,402 million. Non-current assets fell 3.9% to ¥1,038 million, mostly a ¥30 million reduction in capitalised software. Total assets closed at ¥9,440 million, up 9.0%.
Operating cash flow was ¥430 million, against an outflow of ¥119 million in the same half a year earlier — a swing of ¥548 million produced on pre-tax profit that rose only ¥12 million. The ¥528 million increase in contract liabilities inside the cash-flow statement is by far the largest contributor, partly offset by a ¥244 million increase in trade receivables and contract assets and a ¥77 million reduction in payables. Before that working-capital effect, the half's cash generation was ordinary; after it, the group funded itself comfortably and paid nothing out.
Net assets rose 8.3% to ¥2,010 million, essentially all of it the ¥141 million of retained earnings the half generated, since no dividend was paid. Total liabilities rose slightly faster, at 9.2%, so the equity ratio slipped to 20.1% from 20.2%; shareholders' equity was ¥1,900 million against ¥1,752 million. A 20% equity ratio reads as thin until the liability side is examined: it is dominated by ¥4,522 million of contract liabilities and ¥1,928 million of trade payables, with interest-bearing lease obligations of just ¥37 million and no borrowings at all. Non-current liabilities rose 0.7% to ¥402 million on an ¥18 million increase in net defined benefit liability.
EBITDA rises 21.9%, ROIC falls to 13.0%
SIOS reports two management metrics alongside the statutory figures, and this half they point in opposite directions.
EBITDA, which the company defines as operating profit plus depreciation plus goodwill amortisation, was ¥237 million, up 21.9% — growing more than twice as fast as operating profit's 9.0%. The cause is not an operating improvement. Depreciation rose to ¥41 million from ¥14 million, close to three times the prior-year charge. A metric that adds back a cost is always flattered by a period in which that cost triples, so the 21.9% should be read as a statement about capitalised investment coming through the P&L, not about trading.
ROIC — annualised, and defined by the company as after-tax operating profit divided by the sum of shareholders' equity and interest-bearing debt — fell to 13.0% from 14.3%. The capital base grew: shareholders' equity was 8.4% higher than at the December year-end. The 1.79% operating margin could not earn enough on it to hold the ratio.
Guidance unchanged, and a ¥5 dividend returns after a year without one
Management's description of conditions is conventional. Japan's economy recovered gradually on improving employment and income and the effects of policy measures, while the Middle East situation and US trade policy left the outlook opaque. Within information services, it sees firm IT-investment demand aimed at efficiency and productivity on the back of rapid innovation in generative AI and AI agents, set against intensifying competition driven by an IT-talent shortage and a widening set of required technical domains. The group states its mission as "For people all over the world, making the impossible possible", and says it will keep expanding its stock-type business model and strengthening the business through AI and open-source software.
Full-year guidance for FY12/2026 is unchanged from the February 12, 2026 announcement: revenue of ¥20,000 million, up 4.9%; operating profit of ¥450 million, up 12.1%; ordinary profit of ¥510 million, up 2.5%; and net profit attributable to owners of parent of ¥370 million, up 15.6%, for EPS of ¥42.68.
The first half delivered 54.7% of the revenue target but only 43.6% of the operating-profit target. Ordinary-profit progress was 47.0% and net-profit progress 38.2%. Rearranged, the guidance requires a second half of roughly ¥9,056 million of revenue — less than the ¥10,944 million just booked — carrying about ¥254 million of operating profit, an implied second-half operating margin near 2.8% against 1.79% in the first. Since the full-year revenue target sits only 4.9% above the prior year while the first half grew 15.4%, the guidance embeds a second half that does not repeat the Elastic-driven surge and instead earns its profit on a better mix. Nothing in the disclosure explains how that mix arrives; the subscription build in Product & Service is the obvious candidate, but it is also the thing currently depressing that segment's reported revenue.
On the dividend, the framing matters. SIOS paid nothing for FY12/2025 — no interim, no year-end. For FY12/2026 it again forecasts nothing at the interim but ¥5.00 at the year end, ¥5.00 for the year, unchanged from its previous forecast. Against guided EPS of ¥42.68 that is a payout ratio of 11.7%, or roughly ¥43 million of cash on the 8,669,062 shares outside treasury — a tenth of the operating cash flow the first half alone produced. Shares issued were unchanged at 8,874,400 and treasury shares unchanged at 205,338.
The filing reports no significant subsequent events, no change in the scope of consolidation, and no changes in accounting policy, accounting estimates or restatements. As an interim tanshin it is not subject to audit-firm review.
| Metric | H1 FY12/2026 | H1 FY12/2025 | Change |
|---|---|---|---|
| Revenue (¥ million) | 10,944 | 9,486 | +15.4% |
| Cost of sales (¥ million) | 8,197 | 6,905 | +18.7% |
| Gross profit (¥ million) | 2,747 | 2,581 | +6.4% |
| Gross margin | 25.1% | 27.2% | −2.1 pt |
| SG&A expenses (¥ million) | 2,550 | 2,401 | +6.2% |
| Operating profit (¥ million) | 196 | 179 | +9.0% |
| Operating margin | 1.79% | 1.90% | −0.11 pt |
| EBITDA (¥ million) | 237 | 194 | +21.9% |
| Ordinary profit (¥ million) | 239 | 221 | +8.2% |
| Pre-tax profit (¥ million) | 233 | 221 | +5.4% |
| Net profit attrib. to owners of parent (¥ million) | 141 | 119 | +18.2% |
| Comprehensive income (¥ million) | 148 | 96 | +53.7% |
| EPS (¥) | 16.28 | 13.77 | +18.2% |
| ROIC (annualised) | 13.0% | 14.3% | −1.3 pt |
| Operating cash flow (¥ million) | 430 | −119 | +¥548m |
| Product & Service — revenue (¥ million) | 2,483 | 2,365 | +5.0% |
| Product & Service — segment profit (¥ million) | 314 | 284 | +10.3% |
| Consulting & Integration — revenue (¥ million) | 1,687 | 1,749 | −3.5% |
| Consulting & Integration — segment profit (¥ million) | 210 | 213 | −1.5% |
| Software Sales & Solution — revenue (¥ million) | 6,773 | 5,371 | +26.1% |
| Software Sales & Solution — segment profit (¥ million) | 92 | 72 | +27.3% |
| Total assets (¥ million) | 9,440 | 8,662 | +9.0% |
| Contract liabilities (¥ million) | 4,522 | 3,952 | +14.4% |
| Net assets (¥ million) | 2,010 | 1,856 | +8.3% |
| Equity ratio | 20.1% | 20.2% | −0.1 pt |
| FY12/2026 guidance — revenue (¥ million) | 20,000 | — | +4.9% |
| FY12/2026 guidance — operating profit (¥ million) | 450 | — | +12.1% |
| FY12/2026 guidance — ordinary profit (¥ million) | 510 | — | +2.5% |
| FY12/2026 guidance — net profit (¥ million) | 370 | — | +15.6% |
| FY12/2026 guidance — EPS (¥) | 42.68 | — | — |
| Dividend per share, full year (¥) | 5.00 | 0.00 | Reinstated |
JapanStockPulse provides informational content only and does not constitute investment advice. Figures are taken from the company's published earnings short report and may be subject to subsequent revision.