Four headline lines, four separate explanations
Daio Paper Corporation (TSE: 3880), the Ehime-based maker of newsprint, printing paper, paperboard and — through the Elleair brand — tissue, diapers and other household paper products, published consolidated results for the first quarter of the year ending March 31, 2027 under Japanese GAAP on August 6, 2026. The quarter covers April 1 to June 30, 2026, and figures below ¥1 million are truncated rather than rounded, so component sums differ from stated totals by a few million yen.
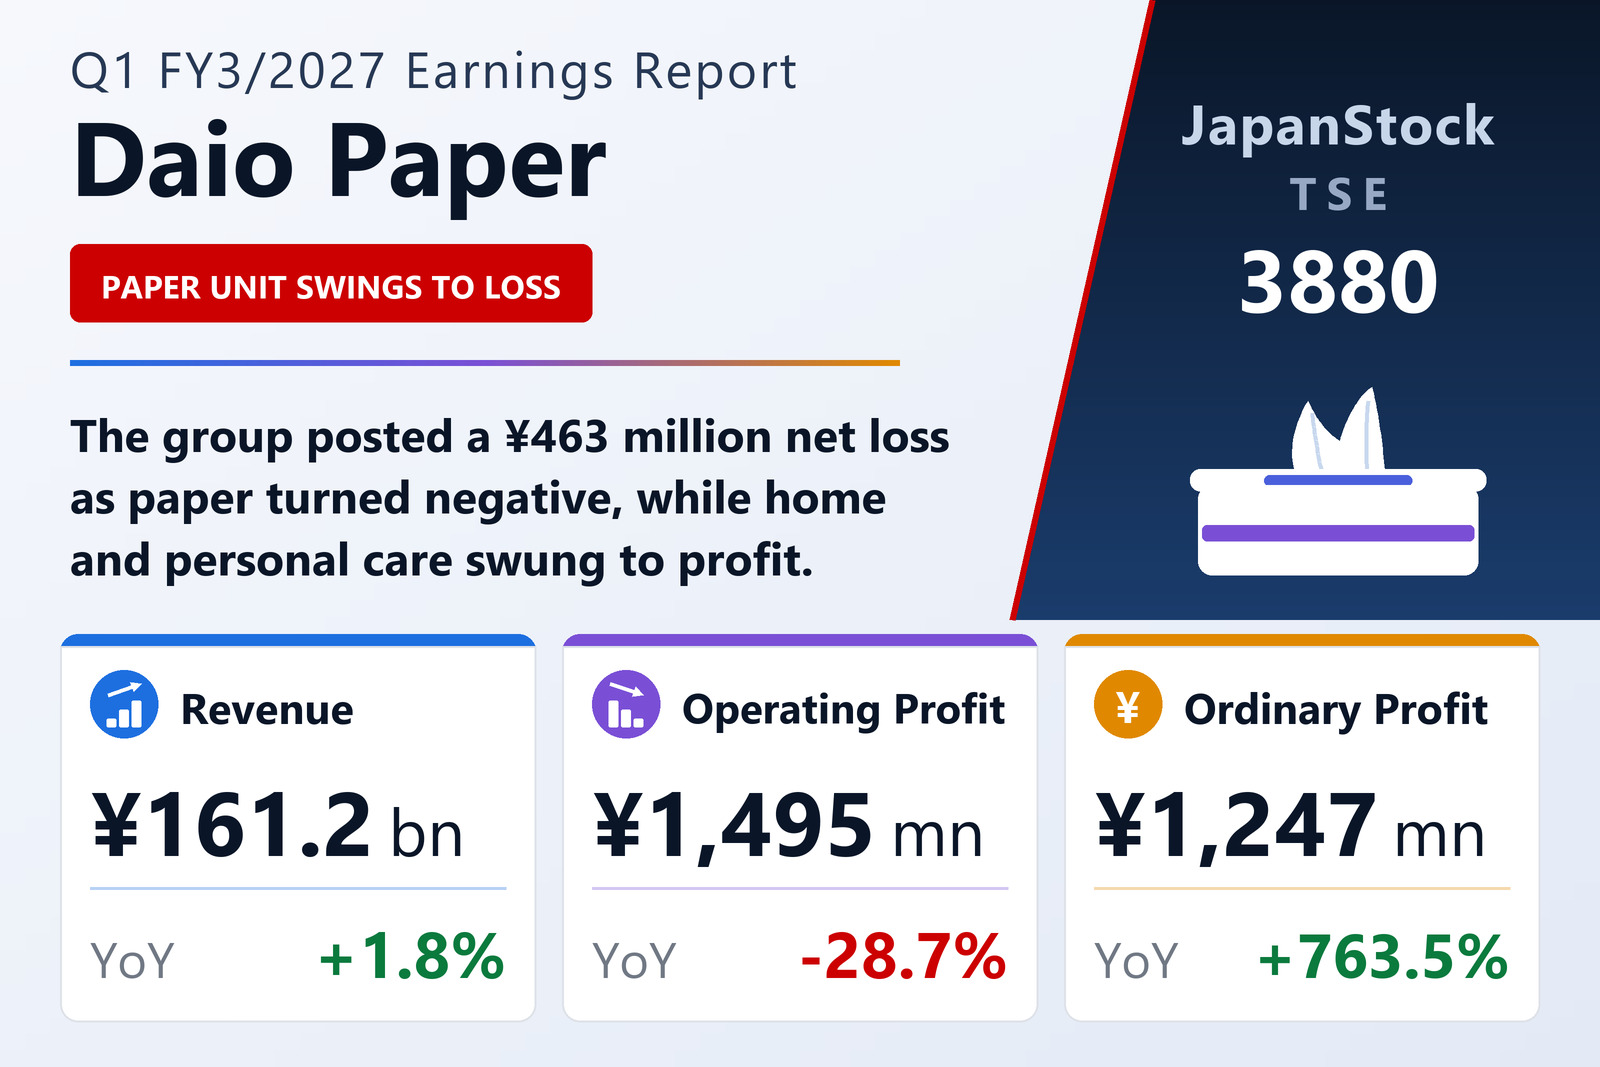
What makes this set of results awkward to summarise is that the four headline lines point in four directions. Revenue rose 1.8% to ¥161,160 million from ¥158,233 million — a reversal of the prior-year quarter's 4.8% decline. Operating profit fell 28.7% to ¥1,495 million. Ordinary profit rose 763.5% to ¥1,247 million from ¥144 million. And the bottom line went the other way again, to a net loss attributable to owners of parent of ¥463 million against a ¥335 million profit. Each step has its own driver, and none of them cancels another out; they simply happen at different levels of the income statement.
Revenue is the cleanest of the four. Price revisions carried through in Paper & Paperboard and in the domestic Home & Personal Care business, and that was enough to more than offset the revenue the group gave up by restructuring its overseas Home & Personal Care operations. The gain came from price, not from volume — in most of the group's product lines shipment volumes were flat or lower, and it was the value per unit that moved. Cost of sales rose faster than revenue, to ¥125,634 million from ¥123,264 million, so gross profit added only ¥558 million while selling, general and administrative expenses added ¥1,160 million, to ¥34,030 million. That ¥602 million gap is essentially the whole operating-profit decline. The operating margin came in at 0.9%, against 1.3% — thin in both years, which is why relatively small cost movements swing the reported percentage so violently.
Context for all of this is the final year of the group's Fifth Medium-Term Business Plan, running from FY2024 to FY2026 under the long-term vision "Daio Group Transformation 2035". Its three themes are strengthening the generation of operating cash flow, executing selective investment for future growth, and strengthening the financial base. Management describes the current year as the one in which the restructuring and profitability measures of the past two years are meant to show through in the numbers, while a growth platform is built for the sixth plan.
Paper & Paperboard turns negative — a value gain that production cuts took back
The larger of the two reporting segments went from a ¥1,985 million segment profit to a ¥257 million segment loss, a ¥2,242 million deterioration, on external revenue of ¥86,098 million, up only 0.7%. That single swing is larger than the entire consolidated operating profit, and it is the reason the group's operating line fell.
Product by product, the pattern is the same one Japanese paper makers have been reporting for several years: volume down, price up, value roughly flat. Newsprint shipments fell as newspaper circulation and page counts continued to shrink, but price revisions lifted newsprint revenue above the prior year. Printing and writing paper saw demand keep eroding as digitalisation displaced flyers and pamphlets, and revenue came in level with a year earlier only because prices had been raised. Packaging and functional materials was the one genuinely healthy line — some uses weakened as charging for paper bags became normal, but e-commerce delivery packaging and environmentally considerate products held volumes flat and price revisions pushed revenue up. Paperboard and corrugated saw export sales to China and Southeast Asia fall while domestic corrugated demand held up comparatively well, leaving both volume and revenue level.
Add those up and revenue is flat. The loss therefore comes entirely from the cost side, and the company names three causes: production cutbacks, the resulting deterioration in absorption of manufacturing fixed costs, and higher raw-material and fuel prices — principally wood chips and chemicals. The mechanism matters more than the arithmetic here. A paper mill's cost base is dominated by fixed conversion cost; when a producer cuts machine running rates to match softer demand rather than build inventory, the fixed cost per tonne rises, and the price increases that lifted revenue by 0.7% were nowhere near large enough to cover it. Including inter-segment sales of ¥3,067 million, total segment revenue was ¥89,165 million.
Home & Personal Care swings to profit on the overseas restructuring
The consumer-products segment moved the other way, from a ¥182 million segment loss to a ¥1,159 million segment profit, on external revenue of ¥71,580 million, up 3.4% — the fastest growth of the three segments. The company is explicit that the swing was driven principally by the restructuring of the overseas business, not by domestic trading.
Domestically the picture was broad-based. In family care, price revisions taken in response to higher raw-material, logistics and labour costs carried through, and value-added lines — soft-pack tissue, long-roll toilet paper — grew. In health care, adult incontinence products grew in both volume and value on those price revisions, on night-time products designed to reduce the burden of overnight caregiving, and on new value-added products developed for hospital and care-facility channels. Feminine care grew on shorts-type and slim napkins and on the absorbent-care products launched in the prior year, helped by design-led editions. Baby care grew on the new "GOO.N More Zero e" series, launched with a well-received celebrity television campaign, and on price revisions in pants-type diapers. Household care grew on the person- and surface-wipe products introduced last year. The one line to fall was pet care: cat litter and sheets for system litter trays sold well and a renewed dog sheet contributed materially, but revenue still fell year on year because a customer moved pet-product manufacturing in-house.
Overseas, the profitability improvement is the story. China improved on the restructuring itself plus expanded feminine-care sales at key accounts, with baby diapers recovering as the company pushed specifications using locally tailored SAP sheets. Brazil grew volume on area- and channel-specific selling and on a wider value-added range. Thailand improved as the focus shifted to premium products in each category. On the revenue line, those gains and a favourable move in local currencies more than offset the sales the group lost by disposing of its Turkish subsidiary in the prior year.
Within the same section the company adds a forward-looking warning worth reading carefully: the impact of the Middle East situation on the quarter just reported was limited, but it expects raw-material and fuel price increases, and possible delivery delays or procurement shortfalls, from the second quarter onwards, and says each country and division is working through mitigation measures. That caution sits alongside guidance that was not changed.
Note also that the segment boundary moved this quarter. Part of what used to sit inside Home & Personal Care was transferred into Paper & Paperboard following a review of performance-management units, and the prior-year comparatives above have been restated onto the new basis. The third segment, "Other" — timber, afforestation, machinery, logistics, golf courses and, newly this year, cellulose nanofibre — produced external revenue of ¥3,481 million, down 0.3%, and segment profit of ¥577 million, up 106.8% from ¥279 million, almost entirely because a one-off repair cost incurred in the timber business a year earlier did not repeat.
Ordinary profit multiplies eight-fold — on the currency line, not the business
The jump from ¥144 million to ¥1,247 million of ordinary profit looks dramatic and is largely an artefact of how small the prior-year base was. Non-operating income more than doubled, to ¥3,274 million from ¥1,564 million, and the components explain themselves. The group booked a ¥981 million foreign-exchange gain where the prior-year quarter had instead carried a ¥458 million exchange loss among non-operating expenses — a swing of ¥1,439 million on the currency lines alone. Dividend income rose to ¥584 million from ¥218 million and interest income to ¥532 million from ¥331 million. Against that, equity-method investment income fell to ¥61 million from ¥196 million, and the ¥318 million gain on net monetary position that hyperinflation accounting produced a year ago did not recur.
Non-operating expenses barely moved in total — ¥3,522 million against ¥3,519 million — but the mix changed. Interest expense rose to ¥1,712 million from ¥1,453 million, and derivative valuation losses rose to ¥1,213 million from ¥837 million; the absence of any exchange loss is what kept the total flat. The net effect is that a ¥603 million fall in operating profit was overwhelmed by a ¥1,710 million improvement in non-operating income, producing the ¥1,103 million gain at the ordinary line. None of that improvement came from selling more paper.
How a ¥954 million pre-tax profit became a ¥463 million loss for shareholders
This is the step the headline number actually turns on, and it has three components rather than one.
First, extraordinary income collapsed to ¥120 million from ¥2,765 million. The prior-year quarter contained a ¥2,712 million reversal of the business-restructuring provision; there was no such reversal this year. What remained was ¥8 million of gains on fixed-asset sales, ¥8 million of insurance proceeds and a ¥103 million reversal of the provision for loss on transfer of affiliate interests. Extraordinary losses also fell, to ¥413 million from ¥1,037 million, because the ¥911 million of business-restructuring expenses booked a year ago did not repeat — though disaster losses rose to ¥353 million from ¥23 million. Netting the two, the extraordinary lines contributed ¥1,728 million of profit in the prior-year quarter and a ¥293 million drag this time. Pre-tax profit therefore fell 49.0%, to ¥954 million from ¥1,872 million, even though ordinary profit rose.
Second, tax. The total charge was ¥928 million on ¥954 million of pre-tax profit — an effective rate of 97.3%, against ¥1,427 million on ¥1,872 million, or 76.2%, a year earlier. Both figures sit far above Japan's statutory rate, which is characteristic of a group carrying loss-making subsidiaries whose losses cannot be offset against the profits taxed elsewhere. Current tax of ¥1,032 million was partly offset by a ¥103 million deferred-tax credit. What is left after tax is ¥25 million of consolidated net income, down from ¥445 million.
Third, minority interests. Profit attributable to non-controlling interests was ¥489 million, up from ¥109 million — nearly twenty times the ¥25 million of consolidated net income available to split. Subtracting it is what produces the ¥463 million loss attributable to owners of parent, and the per-share result of −¥3.01 against ¥2.02. The share count moved too: the weighted average fell 7.3% to 154,220,547 from 166,416,657, following buybacks in the prior year, with treasury and average-share counts including shares held by the director and employee share-delivery trusts. That reduction is accretive to per-share figures; applied to the prior year's profit it would have produced EPS of about ¥2.17. In other words the swing to a per-share loss is entirely about the numerator.
Comprehensive income swings by ¥11.4 billion, and the balance sheet quietly improves
The one line that moved decisively in the group's favour is the one that does not pass through the income statement. Comprehensive income was ¥4,405 million against ¥6,991 million of comprehensive loss a year earlier — an ¥11,396 million swing, almost all of it currency translation. The translation adjustment contributed +¥4,275 million this quarter against −¥6,389 million in the prior-year quarter, a ¥10,664 million reversal, as the yen weakened against the currencies of the group's overseas operations instead of strengthening. Available-for-sale securities added ¥316 million where they had subtracted ¥822 million. Of the total, ¥2,921 million is attributable to owners of parent and ¥1,484 million to non-controlling interests.
That flows straight onto the balance sheet. Total assets rose ¥2,687 million to ¥856,617 million, with cash and deposits up ¥9,483 million to ¥105,509 million and inventories up ¥3,791 million to ¥114,897 million, against a ¥10,468 million fall in notes, accounts receivable and contract assets, to ¥107,010 million. Liabilities fell ¥643 million to ¥610,529 million, as a ¥7,211 million reduction in short-term borrowings was partly offset by higher other current liabilities. Adding up bonds and borrowings on both sides of the one-year line, interest-bearing debt fell about ¥7,058 million to roughly ¥404,886 million.
Net assets rose ¥3,330 million to ¥246,088 million, chiefly on that translation gain, which lifted the foreign-currency translation reserve to ¥20,957 million from ¥17,725 million. Retained earnings fell ¥1,552 million — the ¥463 million loss plus roughly ¥1,089 million of dividends paid. Shareholders' equity ended at ¥228,756 million and the equity ratio edged up 0.1 point to 26.7%. Depreciation for the quarter was ¥11,102 million, up from ¥10,616 million, with goodwill amortisation of ¥982 million; no quarterly consolidated cash-flow statement was prepared.
Guidance left untouched — which implies a very large second quarter
The company reaffirmed the forecast it published on May 15, 2026, in full. For the first half it guides revenue of ¥327,500 million, up 2.5%, operating profit of ¥4,500 million, down 47.4%, ordinary profit of ¥2,500 million, down 59.2%, and net profit attributable to owners of parent of ¥5,000 million, up 14.0%, for EPS of ¥32.42. For the full year it guides revenue of ¥680,000 million, up 2.0%, operating profit of ¥24,000 million, down 0.1%, ordinary profit of ¥17,000 million, down 20.3%, and net profit of ¥12,000 million, up 35.0%, for EPS of ¥77.81.
Subtracting the quarter just reported gives the implied second quarter, and it is demanding. Revenue of ¥166,340 million is unremarkable. Operating profit of ¥3,005 million would be double the first quarter's. But net profit attributable to owners of parent would have to be ¥5,463 million in a single quarter, against a ¥463 million loss in the one just closed — and against ordinary profit implied at only ¥1,253 million for the same three months. Achieving that from an ordinary profit of that size requires extraordinary income, a tax benefit, or both.
The full year carries the same tension in a different form. Only 6.2% of the guided operating profit was earned in the first quarter, so ¥19,500 million — 81% of the year's operating profit — is guided into the second half. And the shape of the full-year forecast is itself unusual: ordinary profit is guided down 20.3% while net profit attributable to owners of parent is guided up 35.0%, so the company is assuming that the tax charge and the minority-interest deduction, which between them consumed every yen of pre-tax profit this quarter, will take only about 29% of ordinary profit across the year. The first quarter has produced no evidence for that assumption yet, and management's own warning about Middle East-driven input costs from the second quarter onwards points the other way.
The dividend is unchanged. FY3/2026 paid ¥7.00 at the interim and ¥7.00 at the year-end for ¥14.00, and FY3/2027 is forecast at the same ¥7.00 plus ¥7.00. Against guided EPS of ¥77.81 that is a payout ratio of about 18.0%, and roughly ¥2.16 billion of cash at the current share count.
Subsequent event: two Indonesian subsidiaries to be dissolved
At a board meeting on July 17, 2026 — after the quarter closed but before this report was filed — Daio Paper resolved to dissolve and liquidate two consolidated Indonesian subsidiaries. PT. Elleair International Trading Indonesia (EITI), capitalised at IDR 1,698.0 billion and owned 99.997% by Daio Paper and 0.003% by Elleair Product Co., Ltd., imported and sold disposable diapers. PT. Elleair International Manufacturing Indonesia (EIMI), capitalised at IDR 806.7 billion and owned 99.994% by Daio Paper and 0.006% by Elleair Product, manufactured them. Both operate from the Bekasi International Industrial Estate in Cikarang Selatan.
The stated reason is that intensifying price competition in Indonesia in recent years, combined with the global surge in energy and material prices, has produced abrupt changes in the market environment with a persistently opaque outlook, and the company judged that continuing the business would be difficult. Dissolution and liquidation will proceed once the procedures required under local law are complete. The company says the effect on profit and loss is still being examined and has not quantified it — so it is not reflected in the guidance discussed above, and any charge or credit will land in a later quarter.
Read together with the swing to profit in the overseas Home & Personal Care business, the Indonesian decision looks less like a new problem than the continuation of the same programme: the segment's improvement this quarter was attributed to restructuring, and Indonesia is the next market in which the group is choosing to stop competing rather than to keep funding a position.
| Metric | Q1 FY3/2027 | Q1 FY3/2026 | Change |
|---|---|---|---|
| Revenue (¥ million) | 161,160 | 158,233 | +1.8% |
| Operating profit (¥ million) | 1,495 | 2,098 | −28.7% |
| Operating margin | 0.9% | 1.3% | −0.4 pt |
| Non-operating income (¥ million) | 3,274 | 1,564 | +109.3% |
| Ordinary profit (¥ million) | 1,247 | 144 | +763.5% |
| Extraordinary income (¥ million) | 120 | 2,765 | −95.7% |
| Pre-tax profit (¥ million) | 954 | 1,872 | −49.0% |
| Income taxes (¥ million) | 928 | 1,427 | −35.0% |
| Effective tax rate | 97.3% | 76.2% | +21.1 pt |
| Profit attrib. to non-controlling interests (¥ million) | 489 | 109 | +348.6% |
| Net profit/(loss) attrib. to owners of parent (¥ million) | −463 | 335 | Swing to loss |
| Comprehensive income (¥ million) | 4,405 | −6,991 | Swing to income |
| EPS (¥) | −3.01 | 2.02 | Swing to loss |
| Weighted-average shares | 154,220,547 | 166,416,657 | −7.3% |
| Paper & Paperboard — external revenue (¥ million) | 86,098 | 85,509 | +0.7% |
| Paper & Paperboard — segment profit/(loss) (¥ million) | −257 | 1,985 | Swing to loss |
| Home & Personal Care — external revenue (¥ million) | 71,580 | 69,229 | +3.4% |
| Home & Personal Care — segment profit/(loss) (¥ million) | 1,159 | −182 | Swing to profit |
| Other — external revenue (¥ million) | 3,481 | 3,493 | −0.3% |
| Other — segment profit (¥ million) | 577 | 279 | +106.8% |
| Total assets (¥ million) | 856,617 | 853,930 | +0.3% |
| Cash and deposits (¥ million) | 105,509 | 96,026 | +9.9% |
| Interest-bearing debt (¥ million) | 404,886 | 411,944 | −1.7% |
| Net assets (¥ million) | 246,088 | 242,757 | +1.4% |
| Shareholders' equity (¥ million) | 228,756 | 226,909 | +0.8% |
| Equity ratio | 26.7% | 26.6% | +0.1 pt |
| H1 FY3/2027 revenue guidance (¥ million) | 327,500 | — | +2.5% |
| H1 FY3/2027 operating profit guidance (¥ million) | 4,500 | — | −47.4% |
| H1 FY3/2027 net profit guidance (¥ million) | 5,000 | — | +14.0% |
| FY3/2027 revenue guidance (¥ million) | 680,000 | — | +2.0% |
| FY3/2027 operating profit guidance (¥ million) | 24,000 | — | −0.1% |
| FY3/2027 ordinary profit guidance (¥ million) | 17,000 | — | −20.3% |
| FY3/2027 net profit guidance (¥ million) | 12,000 | — | +35.0% |
| FY3/2027 EPS guidance (¥) | 77.81 | — | — |
| Annual dividend per share (¥) | 14.00 | 14.00 | Unchanged |
JapanStockPulse provides informational content only and does not constitute investment advice. Figures are taken from the company's published earnings short report and may be subject to subsequent revision.