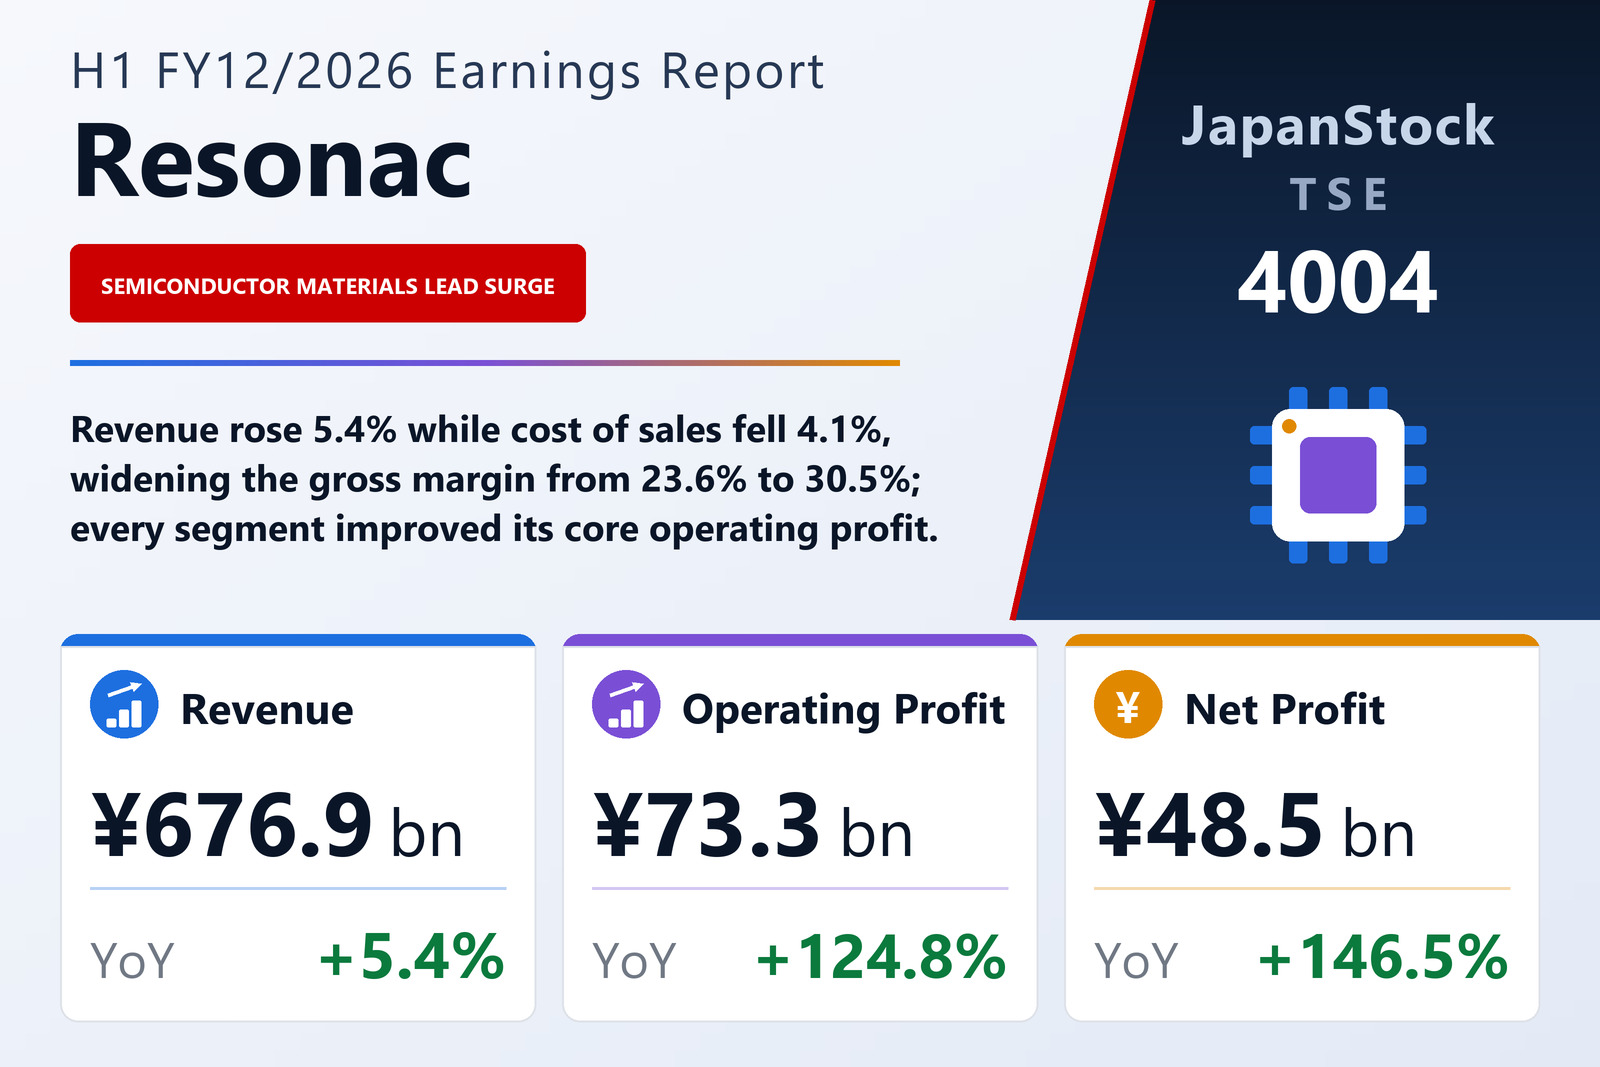
Revenue rose 5.4%, cost of sales fell 4.1% — and that gap is the half
Resonac Holdings Corporation (TSE: 4004), the Tokyo-based chemical group whose products run from semiconductor front-end and back-end materials through automotive components and industrial chemicals to petrochemicals and graphite electrodes, published consolidated first-half results for the six months from January 1 to June 30, 2026 on August 6, 2026 under IFRS. Revenue rose 5.4% to ¥676,852 million, core operating profit 156.5% to ¥88,753 million, operating profit 124.8% to ¥73,310 million and profit attributable to owners of the parent 146.5% to ¥48,451 million, for basic earnings of ¥267.15 per share against ¥108.71. The filing gives the listing exchange as the Tokyo Stock Exchange and does not state a market segment.
The gap between the top line and the cost line is where almost the whole of the result sits. Revenue grew 5.4%, but cost of sales fell 4.1% to ¥470,355 million from ¥490,553 million — an absolute reduction of ¥20,198 million on a base approaching half a trillion yen. Gross profit therefore rose 36.3% to ¥206,497 million, close to seven times the rate of revenue, and the gross margin widened from 23.6% to 30.5%. Selling, general and administrative expenses rose only 1.3% to ¥118,564 million, roughly a quarter of the rate of revenue growth, so essentially all of that gross-margin gain reached the profit line: the core operating margin moved from 5.4% to 13.1%. The filing offers no single group-level reason for the fall in cost of sales; it explains the half segment by segment, and the segment note is where the causes are.
Core operating profit is Resonac's own measure, and its gap to IFRS operating profit widened
Resonac reports core operating profit as its headline earnings measure and defines it in the filing as operating profit excluding gains and losses arising from non-recurring factors — specifically other income, other expenses, and impairment losses included in cost of sales and in selling, general and administrative expenses. The segment note reconciles the two: core operating profit of ¥88,753 million, less impairment losses of ¥820 million, plus other income of ¥4,395 million, less other expenses of ¥19,018 million, gives operating profit of ¥73,310 million. A year earlier the same chain ran from ¥34,598 million, less ¥142 million, plus ¥10,049 million, less ¥11,894 million, to ¥32,611 million. The gap between the two measures therefore widened from ¥1,987 million to ¥15,443 million, which is why operating profit grew 124.8% while core operating profit grew 156.5%. The company attributes the increase in non-recurring losses mainly to a loss recognised on a revision of its retirement benefit plan, and says the rise in core operating profit more than absorbed it.
Below the operating line, a convertible bond separates basic from diluted earnings
Finance costs fell to ¥7,639 million from ¥10,282 million while finance income was little changed at ¥2,430 million and equity-method investment income eased to ¥4,653 million from ¥5,586 million, so pre-tax interim profit rose 139.2% to ¥72,754 million. Income taxes more than doubled, to ¥23,714 million from ¥10,495 million, which is a slightly lower effective rate — 32.6% against 34.5% — on a far larger pre-tax figure. Interim profit was ¥49,040 million, up 146.2%, of which ¥589 million went to non-controlling interests against ¥266 million, leaving ¥48,451 million for owners of the parent. Basic earnings per share were ¥267.15 but diluted earnings per share only ¥240.25, a tenth lower, where a year earlier the two were identical at ¥108.71: the conversion of convertible bonds with share acquisition rights added ¥37,017 million to equity during the half and took issued shares to 191,019,801 from 184,901,292 at the year-end. Comprehensive income swung to ¥64,830 million from a negative ¥6,055 million, a move driven mainly by foreign-currency translation differences of positive ¥14,830 million against negative ¥23,812 million.
Semiconductor and electronic materials produced seven-tenths of the profit growth
The Semiconductor and Electronic Materials segment is where the half was won. External revenue rose 29.6% to ¥298,962 million and segment core operating profit 91.8% to ¥81,485 million. That single segment is 44.2% of group external revenue but 85.5% of the ¥95,297 million of core operating profit the five reporting segments earned between them, and its ¥38,999 million increase is 70.3% of the ¥55,514 million by which reporting-segment profit rose. The causes the filing gives are specific: front-end materials revenue grew as the memory market turned towards recovery; back-end materials grew mainly on higher sales volumes for advanced semiconductors including AI applications; and in device solutions, data-centre demand for hard-disk media held firm while SiC epitaxial wafers gained on increased demand from some customers.
Every segment improved its core operating profit, including the two whose revenue fell
Mobility is the clearest example: external revenue fell 5.6% to ¥84,621 million because the automotive molded-parts business was transferred during the April–June quarter, yet segment core operating profit rose 227.4% to ¥4,282 million on increased demand from some customers. Innovation Materials grew on both lines, revenue 11.3% to ¥49,999 million and core operating profit 27.5% to ¥6,304 million, which the filing describes only as steady trading with variation between products. Chemicals grew revenue 17.0% to ¥91,789 million and cut its core operating loss to ¥612 million from ¥8,151 million: chemical products gained from price revisions made after cost increases on some items, while in graphite a recovery in graphite-electrode sales volumes lifted revenue and the effects of restructuring came through, narrowing the loss.
Kurasus Chemical, the petrochemical business, is the mirror image of Mobility. External revenue fell 13.2% to ¥130,057 million because of a large scheduled maintenance turnaround that comes round once every four years, but core operating profit swung to a positive ¥3,838 million from a loss of ¥806 million on a favourable inventory valuation effect from higher naphtha prices; the company's supplementary summary puts the domestic naphtha price at ¥92,300 per kilolitre against ¥69,850, and the average exchange rate at ¥158.2 to the dollar against ¥148.6. Outside the five reporting segments, revenue in the Other category fell to ¥21,424 million from ¥48,481 million, which the filing does not explain, and unallocated corporate costs deepened to ¥9,956 million from ¥7,390 million. All of the segment revenue figures above are sales to external customers; adding intersegment sales takes the five reporting segments to ¥673,376 million.
The balance sheet and the cash flow both strengthened
Total assets rose 5.2% to ¥2,215,999 million from ¥2,106,723 million at December 31, 2025, an increase of ¥109,276 million that the company attributes mainly to higher cash and cash equivalents and higher inventories. Liabilities rose only 2.3% to ¥1,410,976 million — interest-bearing debt fell, to about ¥956.7 billion from about ¥969.5 billion, while trade payables rose — and total equity rose 10.6% to ¥805,023 million on retained earnings, the convertible-bond conversion and the disposal of treasury shares. Equity attributable to owners of the parent rose 12.8% to ¥788,109 million and the ratio of that equity to total assets improved from 33.2% to 35.6%. A balance sheet that expanded by ¥109,276 million while taking on ¥31,866 million of additional liabilities is one that funded most of its own growth.
Operating cash flow was ¥84,403 million against ¥34,630 million, an increase of ¥49,773 million that follows the rise in interim profit; depreciation and amortisation was ¥45,761 million against ¥47,475 million. Investing outflows widened to ¥56,993 million from ¥47,886 million — purchases of property, plant and equipment fell, but the prior-year half had included proceeds from the sale of subsidiaries — leaving free cash flow of positive ¥27,410 million against negative ¥13,256 million. Financing swung to an inflow of ¥9,477 million from an outflow of ¥64,359 million, on an increase in short-term borrowings and the absence of the bond redemption that fell in the prior-year half. Cash and cash equivalents ended the half at ¥327,067 million, ¥65,096 million above the ¥261,971 million held at the year-end.
Guidance raised on every profit line, and cut on revenue for a reason that is not a downgrade
Resonac revised its full-year FY12/2026 guidance in a separate release on the same day, August 6, 2026. It now expects revenue of ¥1,165,000 million (+11.3%), core operating profit of ¥196,000 million (+87.7%), operating profit of ¥160,000 million (+278.5%), pre-tax profit of ¥158,000 million (+298.2%), profit of ¥114,000 million and profit attributable to owners of ¥112,500 million (+287.5%), for earnings of ¥606.32 per share. Measured against the previous forecast of February 13, every profit line moves up sharply — core operating profit by ¥56,000 million or 40.0%, operating profit by ¥55,000 million or 52.4%, pre-tax profit by ¥55,000 million or 53.4% and profit attributable to owners by ¥35,500 million or 46.1% — while revenue is cut by ¥145,000 million, or 11.1%, from ¥1,310,000 million.
That revenue cut is a change of basis rather than a change of view, and the filing says so plainly. Because the partial spin-off of Kurasus Chemical is expected to go to the board in late August 2026, the guidance treats the Kurasus Chemical segment as a discontinued operation from the start of the year: revenue, core operating profit, operating profit and pre-tax profit are stated for continuing operations only, while profit and profit attributable to owners combine continuing and discontinued operations, and the percentage changes are measured against an FY12/2025 restated on the same basis. The guidance also excludes any gain or loss arising on deconsolidation. One consequence is that the half just reported is not directly comparable with it: the ¥676,852 million of first-half revenue includes ¥130,057 million from Kurasus Chemical, and the ¥88,753 million of first-half core operating profit includes ¥3,838 million from it. The company's segment guidance shows where the year is expected to come from — Semiconductor and Electronic Materials is guided to core operating profit of about ¥195.0 billion, against about ¥196.0 billion for continuing operations as a whole.
Dividend unchanged, and a spin-off that will change the shape of the group
The dividend forecast was not revised. No interim dividend was declared, as none was a year earlier, and the year-end forecast is ¥65.00 per share for an annual ¥65.00, the same as FY12/2025. The company notes that this figure does not include the in-kind distribution of Kurasus Chemical shares that the spin-off would deliver. That transaction is the filing's material subsequent event: at a management meeting on July 6, 2026 Resonac decided the policy of putting the partial spin-off to a board meeting in late August 2026, to be executed by distributing more than 80% of Kurasus Chemical's ordinary shares to Resonac shareholders in kind. From the third quarter of FY12/2026 the segment will be classified as a discontinued operation under IFRS 5, and after the spin-off Resonac's holding would fall below 20%, so Kurasus Chemical would cease to be a consolidated subsidiary and would not be accounted for by the equity method either. The filing states that the effect on the consolidated financial statements is still being examined, so the accounting consequences of the largest change to the group's shape in this report are not yet quantified.
| Metric | H1 FY12/2026 | H1 FY12/2025 | Change |
|---|---|---|---|
| Revenue (¥ million) | 676,852 | 642,054 | +5.4% |
| Gross profit (¥ million) | 206,497 | 151,501 | +36.3% |
| Gross margin | 30.5% | 23.6% | +6.9 pt |
| SG&A expenses (¥ million) | 118,564 | 117,045 | +1.3% |
| Core operating profit (¥ million) | 88,753 | 34,598 | +156.5% |
| Operating profit (¥ million) | 73,310 | 32,611 | +124.8% |
| Pre-tax profit (¥ million) | 72,754 | 30,415 | +139.2% |
| Net profit attrib. to owners of parent (¥ million) | 48,451 | 19,654 | +146.5% |
| EPS (¥) | 267.15 | 108.71 | +145.7% |
| Semiconductor & Electronic Materials — revenue (¥ million) | 298,962 | 230,680 | +29.6% |
| Semiconductor & Electronic Materials — core operating profit (¥ million) | 81,485 | 42,486 | +91.8% |
| Mobility — revenue (¥ million) | 84,621 | 89,659 | −5.6% |
| Mobility — core operating profit (¥ million) | 4,282 | 1,308 | +227.4% |
| Innovation Materials — revenue (¥ million) | 49,999 | 44,922 | +11.3% |
| Innovation Materials — core operating profit (¥ million) | 6,304 | 4,946 | +27.5% |
| Chemicals — revenue (¥ million) | 91,789 | 78,428 | +17.0% |
| Chemicals — core operating profit (¥ million) | −612 | −8,151 | loss narrowed |
| Kurasus Chemical — revenue (¥ million) | 130,057 | 149,884 | −13.2% |
| Kurasus Chemical — core operating profit (¥ million) | 3,838 | −806 | loss to profit |
| Total assets (¥ million) | 2,215,999 | 2,106,723 | +5.2% |
| Total liabilities (¥ million) | 1,410,976 | 1,379,110 | +2.3% |
| Equity attrib. to owners of parent (¥ million) | 788,109 | 698,852 | +12.8% |
| Equity ratio | 35.6% | 33.2% | +2.4 pt |
| Operating cash flow (¥ million) | 84,403 | 34,630 | +143.7% |
| Free cash flow (¥ million) | 27,410 | −13,256 | n.m. |
| FY12/2026 guidance — revenue (¥ million) | 1,165,000 | — | +11.3% |
| FY12/2026 guidance — core operating profit (¥ million) | 196,000 | — | +87.7% |
| FY12/2026 guidance — operating profit (¥ million) | 160,000 | — | +278.5% |
| FY12/2026 guidance — pre-tax profit (¥ million) | 158,000 | — | +298.2% |
| FY12/2026 guidance — net profit (¥ million) | 112,500 | — | +287.5% |
| Annual dividend per share (¥) | 65.00 | 65.00 | unchanged |
JapanStockPulse provides informational content only and does not constitute investment advice. Figures are taken from the company's published earnings short report and may be subject to subsequent revision.