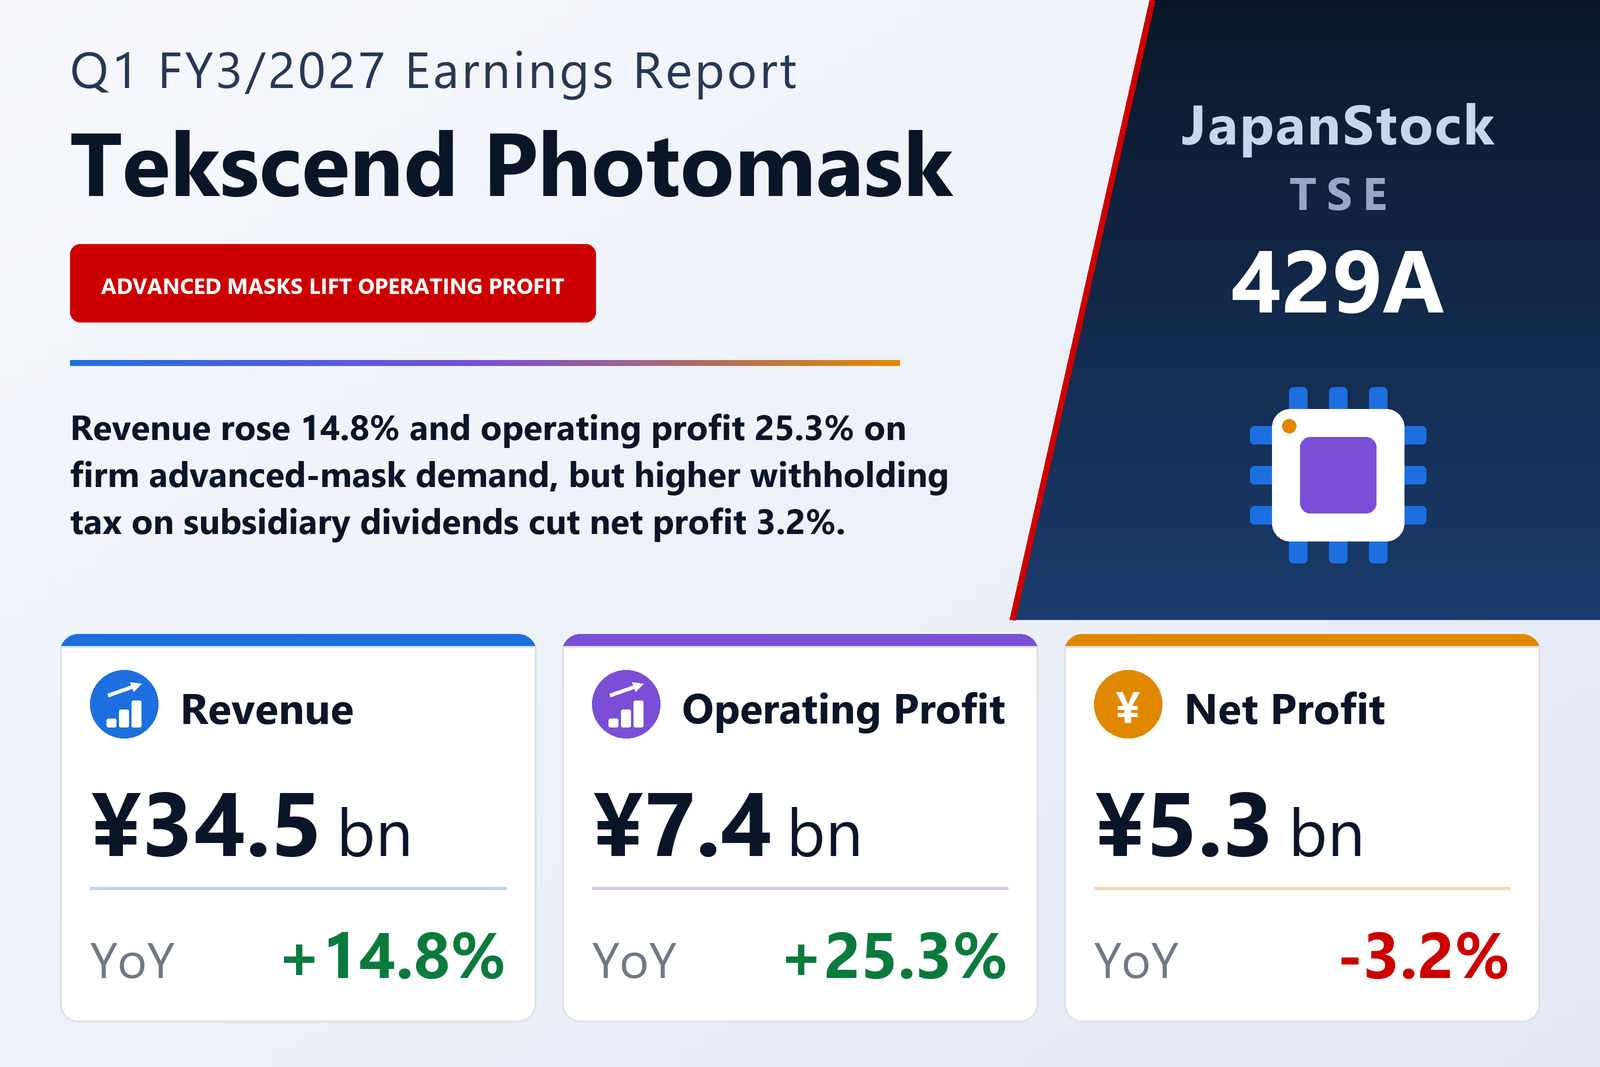
Operating profit grew 25.3% on revenue up 14.8%
Tekscend Photomask Corp. (TSE: 429A), which makes photomasks for semiconductor production, including EUV masks, across what it describes as a global network of eight production sites, published consolidated first-quarter results for the three months from April 1 to June 30, 2026 on August 6, 2026 under IFRS. Revenue rose 14.8% to ¥34,518 million, operating profit 25.3% to ¥7,360 million and pre-tax profit 19.5% to ¥8,127 million, while profit attributable to owners of the parent fell 3.2% to ¥5,300 million, for basic earnings per share of ¥53.36 against ¥59.33. The company reports a single segment, the photomask-related business, and is listed on the Tokyo Stock Exchange.
The step-up at the operating line can be read straight off the income statement. Cost of sales rose 13.8% to ¥23,053 million, a little slower than revenue, so gross profit rose 16.8% to ¥11,464 million and the gross margin widened from 32.6% to 33.2%. Selling, general and administrative expenses grew only 7.4% to ¥3,835 million, research and development expenses were flat at ¥266 million, and other expenses fell to ¥36 million from ¥114 million while other income rose to ¥32 million from ¥18 million. Of the ¥1,485 million increase in operating profit, the ¥1,653 million rise in gross profit did almost all the work, with SG&A absorbing ¥263 million of it. The operating margin moved from 19.5% to 21.3%. The filing gives no product or price breakdown behind the gross-margin gain.
Tax, not trading, took net profit lower
Below the operating line, finance income rose to ¥1,324 million from ¥1,198 million, finance costs to ¥699 million from ¥400 million, and equity-method investment income was ¥142 million against ¥125 million, so pre-tax profit grew 19.5%, more slowly than operating profit. The filing does not explain the higher finance costs; interest paid in the cash-flow statement rose to ¥283 million from ¥151 million. The decisive line is income tax, which more than doubled to ¥2,827 million from ¥1,323 million and lifted the effective tax rate from 19.5% to 34.8%. The company attributes the fall in net profit to higher withholding tax on dividends from overseas subsidiaries; it does not quantify that tax or say whether it will recur.
Earnings per share fell further than profit, by 10.1%, because the average number of shares outstanding rose 7.6%, to 99,340,676 from 92,291,220; the company holds no treasury stock. Comprehensive income moved the other way, rising 68.9% to ¥8,522 million. Other comprehensive income was ¥3,221 million against −¥429 million a year earlier, and ¥3,117 million of it came from exchange differences on translating foreign operations: a revaluation of the balance sheet rather than trading profit.
AI servers, HBM and advanced nodes set the backdrop
The filing describes a semiconductor market that kept expanding sharply, driven by data-centre investment as generative AI spreads and by tight supply and rising prices for memory products, high-bandwidth memory (HBM) in particular. Demand for leading-edge logic and HBM for AI servers stayed high and led market growth. Photomask demand was firm, centred on advanced nodes, and in the merchant photomask market, which the company says affects its results, demand remained firm, centred on advanced products. The company says it used its advanced microfabrication technology, EUV masks included, and its eight-site production network to supply high-quality photomasks on stable lead times. It describes a world economy that kept growing moderately on AI-related investment and resilient, US-led consumer spending, despite uncertainty from rising energy prices on Middle East tensions and higher geopolitical risk. Because there is only one segment, the filing gives no breakdown of revenue by product, node or region.
Cash flow covered capital spending, but not the dividend as well
Operating cash flow rose to ¥11,578 million from ¥9,027 million, as pre-tax profit of ¥8,127 million and depreciation and amortisation of ¥4,725 million outweighed income taxes paid of ¥4,041 million. Investing outflows fell to ¥7,270 million from ¥15,469 million, chiefly because purchases of property, plant and equipment dropped to ¥7,455 million from ¥13,606 million. Financing outflows were ¥6,468 million against ¥174 million a year earlier, led by ¥5,510 million of dividends paid (none were paid in the prior-year quarter) and ¥767 million of lease repayments. Operating and investing flows together left ¥4,308 million, less than the dividend, and cash and cash equivalents ended the quarter at ¥50,105 million, down ¥1,446 million from March 31 even after a positive currency effect of ¥714 million.
Liabilities fell and the equity ratio rose to 77.2%
Total assets were ¥229,957 million at June 30, 2026, ¥768 million below the March 31 level: other financial assets rose ¥1,104 million while cash fell ¥1,446 million and trade and other receivables ¥600 million. Liabilities fell ¥3,755 million to ¥52,463 million, led by trade and other payables (down ¥1,723 million), income taxes payable (down ¥883 million) and other financial liabilities (down ¥399 million); borrowings stood at ¥1,257 million. Equity attributable to owners of the parent rose ¥2,986 million to ¥177,493 million, mainly on a ¥3,163 million increase in other components of equity, while retained earnings slipped to ¥83,198 million because the ¥5,562 million dividend exceeded the quarter's profit. The equity ratio rose from 75.6% to 77.2%.
Guidance unchanged, with a ¥70 dividend forecast
Full-year FY3/2027 guidance, published on May 13, 2026, is unchanged: revenue of ¥140,100 million (+8.1%), operating profit of ¥29,800 million (+8.2%), pre-tax profit of ¥31,200 million (−6.7%) and profit attributable to owners of ¥23,700 million (−5.0%), for earnings per share of ¥238.57. The first quarter delivered 24.6% of guided revenue, 24.7% of guided operating profit, 26.0% of guided pre-tax profit and 22.4% of guided net profit. Because the quarter's operating profit grew 25.3% while the full-year plan calls for 8.2%, the guidance implies much slower growth over the remaining nine months; the filing does not explain the shape of the plan, nor why pre-tax profit is guided lower for the year.
The dividend forecast is likewise unchanged at ¥70.00 for the year, ¥35.00 at the second-quarter end and ¥35.00 at the year-end, against ¥56.00 for FY3/2026, which was paid entirely as a year-end dividend. That is an increase of 25.0% and a payout of about 29% of guided earnings per share. The company's articles of incorporation set the second-quarter end and the fiscal year-end as its dividend record dates.
| Metric | Q1 FY3/2027 | Q1 FY3/2026 | Change |
|---|---|---|---|
| Revenue (¥ million) | 34,518 | 30,076 | +14.8% |
| Gross profit (¥ million) | 11,464 | 9,811 | +16.8% |
| Gross margin | 33.2% | 32.6% | +0.6 pt |
| SG&A expenses (¥ million) | 3,835 | 3,572 | +7.4% |
| R&D expenses (¥ million) | 266 | 266 | unchanged |
| Operating profit (¥ million) | 7,360 | 5,875 | +25.3% |
| Operating margin | 21.3% | 19.5% | +1.8 pt |
| Finance income (¥ million) | 1,324 | 1,198 | +10.5% |
| Finance costs (¥ million) | 699 | 400 | +74.8% |
| Pre-tax profit (¥ million) | 8,127 | 6,799 | +19.5% |
| Income tax expense (¥ million) | 2,827 | 1,323 | +113.7% |
| Net profit attrib. to owners of parent (¥ million) | 5,300 | 5,475 | −3.2% |
| Comprehensive income (¥ million) | 8,522 | 5,045 | +68.9% |
| EPS (¥) | 53.36 | 59.33 | −10.1% |
| Total assets (¥ million) | 229,957 | 230,725 | −0.3% |
| Equity attrib. to owners of parent (¥ million) | 177,493 | 174,507 | +1.7% |
| Equity ratio | 77.2% | 75.6% | +1.6 pt |
| Cash and cash equivalents at period end (¥ million) | 50,105 | 51,552 | −2.8% |
| Operating cash flow (¥ million) | 11,578 | 9,027 | +28.3% |
| Purchase of property, plant and equipment (¥ million) | 7,455 | 13,606 | −45.2% |
| FY3/2027 guidance — revenue (¥ million) | 140,100 | — | +8.1% |
| FY3/2027 guidance — operating profit (¥ million) | 29,800 | — | +8.2% |
| FY3/2027 guidance — pre-tax profit (¥ million) | 31,200 | — | −6.7% |
| FY3/2027 guidance — net profit (¥ million) | 23,700 | — | −5.0% |
| FY3/2027 guidance — EPS (¥) | 238.57 | — | — |
| Annual dividend per share (¥) | 70.00 | 56.00 | +25.0% |
JapanStockPulse provides informational content only and does not constitute investment advice. Figures are taken from the company's published earnings short report and may be subject to subsequent revision.