A record half — and how much of it the yen paid for
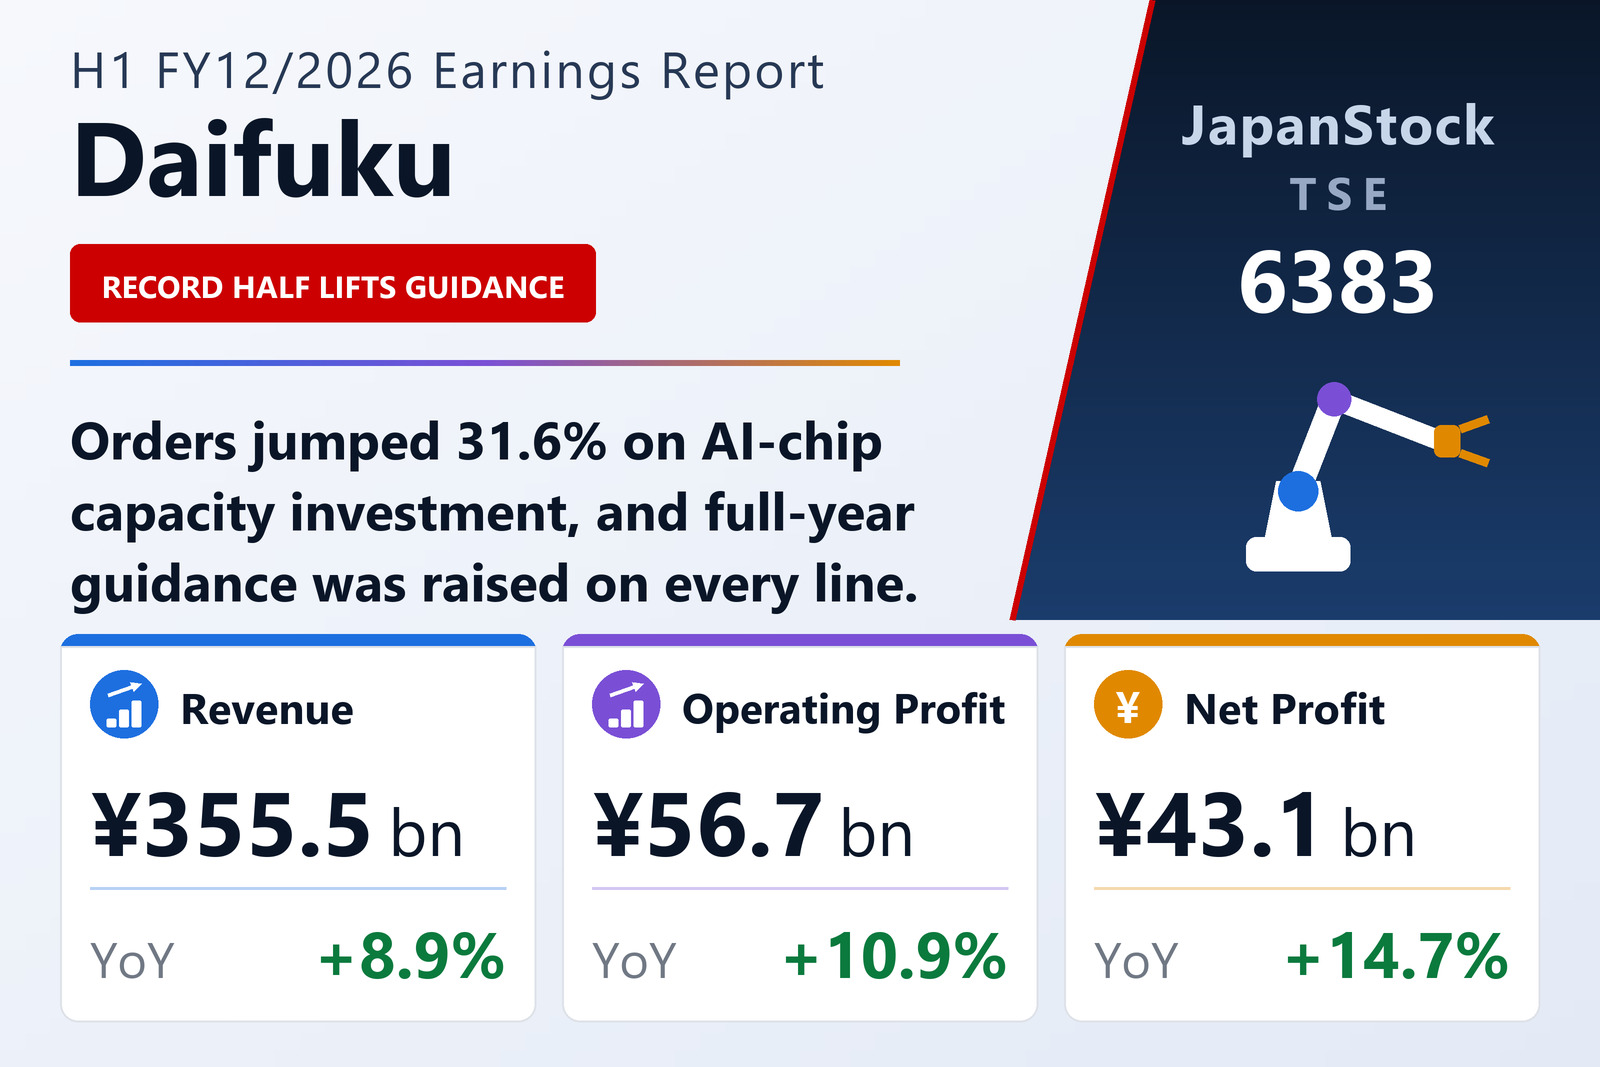
Daifuku Co., Ltd. (TSE: 6383), the Osaka-based maker of automated material-handling systems — the stockers and overhead hoist transport that move wafers around semiconductor fabs, plus warehouse automation, airport baggage handling and car-wash machines — published consolidated results for the first half of FY12/2026, the six months to June 30, 2026, under Japanese GAAP on August 6, 2026. Orders received reached ¥440,186 million, up 31.6%. Revenue was ¥355,513 million, up 8.9%; operating profit ¥56,680 million, up 10.9%; ordinary profit ¥58,666 million, up 11.7%; and net profit attributable to owners of parent ¥43,143 million, up 14.7%. The company states that all five are the highest it has ever recorded for an interim consolidated period.
The currency contribution is disclosed, and it is large. Average rates for the half were ¥158.46 to the US dollar against ¥147.66 a year earlier, ¥23.12 to the Chinese yuan against ¥20.36, ¥0.1066 to the Korean won against ¥0.1038, and ¥5.02 to the Taiwan dollar against ¥4.66. Daifuku puts the year-on-year effect of those moves at roughly ¥18.1 billion on orders, ¥15.3 billion on revenue and ¥2.7 billion on operating profit. Revenue rose ¥29,024 million in total, so currency accounted for about 53% of the increase; operating profit rose ¥5,577 million, so currency accounted for about 48%. Strip the yen out and revenue growth is closer to 4% and operating-profit growth closer to 6%.
Orders are the exception, and the important one. The increase there was on the order of ¥105.7 billion, of which the ¥18.1 billion currency effect is only about 17%. Whatever else this half was, the order surge is real demand rather than a translation artefact. One caveat on the comparison: Daifuku changed its fiscal year-end from March 31 to December 31 with effect from FY12/2024, so the FY12/2025 interim (January–June 2025) does not line up with the FY12/2024 interim (April–September 2024), and the company therefore published no prior-year percentage changes for the FY12/2025 interim. The filing also discloses orders only as a current-period figure and a growth rate; the comparable prior-half figure implied by the 31.6% is roughly ¥334.5 billion.
The order book: generative AI in Korea, domestic substitution in China
The segment order figures show where the money is coming from. Clean Factomation, Inc. (CFI), the Korean cleanroom-automation subsidiary, took ¥64,075 million of orders, up 80.2%, which the company attributes directly to expanding demand for advanced semiconductor investment serving generative AI. Daifuku (Suzhou) DSA took ¥24,906 million, up 76.9%, on continued investment behind China's push to localise semiconductor production. The Contec Group, which sells industrial computers, took ¥13,722 million, up 56.6%.
The largest single order source is still the parent, Daifuku Co., Ltd. itself, at ¥141,576 million, up 47.5%, with general manufacturing and distribution, semiconductor lines and automotive lines all rising. Second is the Daifuku North America (DNA) Group at ¥113,550 million — essentially flat, at −0.0%, but flat at a high level and still a quarter of group orders. The remaining consolidated subsidiaries, grouped as "Other," took ¥82,355 million, up 23.8%, again led by semiconductor lines.
Management's read of the demand environment is worth separating into its parts, because the four drivers are on different clocks. Semiconductors are the accelerator, on generative-AI capacity at advanced nodes and Chinese localisation. General manufacturing and distribution is the steady base, held up by labour shortages and rising wages in Japan and the United States — a structural argument for automation that does not depend on the chip cycle. Automotive is a recovery story: customer investment decisions that stalled last year under US trade policy are gradually unblocking. Airports are a continuation, driven by passenger growth and concentrated in North America. On the strength of that mix Daifuku raised its full-year order guidance to ¥860,000–900,000 million from ¥780,000–820,000 million. The first half's ¥440,186 million is almost exactly half the ¥880 billion midpoint.
Where the revenue actually came from — and where the parent went
Revenue by industry moved very differently from orders. Electronics — the semiconductor business — produced ¥151,353 million, up 19.9%, and now accounts for 42.6% of external revenue. Airports produced ¥43,369 million, up 22.7%. But automotive and auto parts fell 8.8% to ¥37,230 million and commerce and retail fell 12.8% to ¥59,810 million. Both of those are areas where orders are rising; the revenue decline reflects what was in the backlog entering the year rather than what customers are ordering now, which is exactly the lag a project business produces.
By destination the shift is starker. Japan fell 12.6% to ¥81,636 million while overseas rose 17.1% to ¥273,448 million, taking the overseas share of external revenue to 77.0% from 71.4%. Korea more than led it: ¥42,420 million, up 75.2%, the CFI effect. North America contributed ¥95,619 million, up 11.9%; China ¥49,871 million, up 14.0%; Taiwan ¥46,630 million, up 4.2%. Some ¥285,600 million of revenue, or 80.4%, was recognised over time rather than at a point in time — this is a percentage-of-completion business, and the backlog is what converts.
That lag is what produced the half's oddest line. Parent-company revenue fell 16.1% to ¥112,662 million, because the order backlog it carried into the year had grown only modestly — the parent's own order surge, up 47.5%, lands in later periods. Everything else rose: CFI revenue ¥40,077 million, up 112.7%; "Other" ¥79,339 million, up 27.7%; DNA ¥90,773 million, up 12.1%; Contec ¥11,825 million, up 23.5%. DSA slipped 3.0% to ¥20,405 million.
Segment profit needs a health warning. Daifuku defines it as net profit attributable to owners of parent, not operating profit, so each unit's figure includes dividends received from other group companies — ¥25,828 million of which were eliminated in consolidation this half, against ¥17,951 million a year earlier. Reported segment profits sum to ¥68,910 million against consolidated net profit of ¥43,143 million, and the gap is almost entirely that elimination. Within that frame: the parent earned ¥37,193 million, up 9.3%, which the company attributes to improved non-operating items rather than to trading; CFI ¥7,385 million, up 392.3%; "Other" ¥10,642 million, up 79.7%; DSA ¥5,904 million, up 3.4%; Contec ¥666 million, up 97.7%. Only DNA fell, down 12.6% to ¥7,117 million, because the prior year contained a particularly profitable general manufacturing and distribution project.
Gross margin widened; SG&A took most of it back
Gross profit rose 15.9% to ¥92,469 million on revenue growth of 8.9%, lifting the gross margin to 26.0% from 24.4% — 1.6 percentage points, and the mechanical proof of management's claim that semiconductor-line profitability improved. Almost none of it reached the operating line. Selling, general and administrative expenses rose 24.9% to ¥35,789 million, nearly three times the rate of revenue: selling expenses up 18.0% to ¥11,101 million, general and administrative expenses up 28.3% to ¥24,688 million. The SG&A ratio therefore climbed to 10.1% from 8.8%, taking back 1.3 points of the 1.6 the gross margin gained. The operating margin ended at 15.9%, up just 0.3 points from 15.7%. Put in cash terms: gross profit gained ¥12,713 million, SG&A absorbed ¥7,136 million of it, and ¥5,577 million reached operating profit.
Below the operating line the arithmetic runs the other way. Net non-operating income improved to ¥1,987 million from ¥1,420 million even though the foreign-exchange loss widened to ¥931 million from ¥572 million, because non-operating income rose to ¥3,153 million from ¥2,083 million on higher interest and other receipts. Extraordinary items swung to a net gain of ¥127 million — including ¥356 million of gains on sales of investment securities — from a net loss of ¥126 million. Pre-tax profit was ¥58,794 million, and the tax charge of ¥15,652 million represents an effective rate of 26.6%, down from 28.2%. Each step adds a little: operating profit up 10.9%, ordinary profit up 11.7%, net profit up 14.7%, and earnings per share up 14.4% to ¥117.07 from ¥102.32. Diluted EPS rose 14.6% to ¥111.85.
Comprehensive income of ¥50,612 million, up 104.4%, looks spectacular and mostly is not. The swing comes from the currency translation adjustment, which moved to +¥6,877 million from −¥12,333 million — a ¥19.2 billion change driven by revaluing overseas net assets at a weaker yen. That is a balance-sheet effect on assets the group already owned, not a measure of what the business earned.
Convertible bonds converted, and the equity ratio jumped to 62.5%
Total assets reached ¥803,181 million, up ¥48,969 million in six months. Cash and deposits rose ¥8,125 million to ¥269,378 million; property, plant and equipment rose ¥11,191 million to ¥119,269 million; and other current assets rose ¥20,400 million to ¥41,949 million, which is where the deposit for an acquisition discussed below is parked.
Liabilities barely moved in total — down ¥1,159 million to ¥301,491 million — but the composition changed materially. Other current liabilities, mainly accrued expenses, rose ¥12,709 million, while convertible bonds with share acquisition rights fell ¥15,692 million to ¥45,035 million as holders exercised. That conversion is also the largest item in the equity account: 4,443,589 treasury shares were delivered, cutting the treasury-stock deduction by ¥11,472 million to ¥19,260 million and raising capital surplus by ¥4,242 million to ¥24,656 million. Treasury shares fell to 7,616,275 from 12,120,273, against 379,830,231 shares issued.
Net assets therefore rose ¥50,129 million to ¥501,690 million: retained earnings up ¥26,944 million, the treasury-share and capital-surplus effects above, and the ¥6,877 million translation gain. Because equity grew 11.1% while assets grew 6.5%, the equity ratio rose to 62.5% from 59.9% — a debt-free-looking balance sheet getting cleaner still as the convertible converts. Separately, the group adopted Japan's new lease accounting standard from January 1, 2026, recognising ¥14,803 million of lease liabilities at that date — of which ¥7,340 million was newly identified by the standard — discounted at a 2.30% incremental borrowing rate. Prior periods were not restated, so the balance-sheet comparison above is not quite like-for-like on that line.
Cash flow, and the ¥16.6 billion already paid out for Eisenmann
Operating cash flow was ¥52,064 million against ¥44,350 million: pre-tax profit of ¥58,794 million and ¥6,899 million of depreciation, plus a ¥3,176 million increase in contract liabilities, against a ¥7,352 million decrease in trade payables and ¥16,815 million of income taxes paid. Investing used ¥23,619 million against ¥14,076 million — ¥13,933 million on fixed assets and ¥16,613 million on a deposit toward the acquisition of subsidiary shares, offset by ¥7,878 million of time-deposit withdrawals. Free cash flow was therefore ¥28,445 million, slightly below last year's ¥30,274 million despite the stronger operating line. Financing used ¥18,445 million, mostly ¥15,613 million of dividends. Cash and equivalents closed at ¥258,764 million, up ¥13,508 million.
That ¥16,613 million deposit is the whole reason free cash flow fell, and it is disclosed as a subsequent event. On July 1, 2026 — one day after the balance-sheet date — Daifuku completed the purchase of 100% of Eisenmann GmbH of Germany for ¥16,613 million in cash, following a board resolution of April 17, 2026. Eisenmann designs and engineers industrial painting and surface-treatment plant and the conveyance systems that serve it.
The stated rationale sits under Daifuku's "Driving Innovative Impact 2030" long-term vision and its push to expand overseas: European automotive production lines demand end-to-end capability against European standards and customer-specific requirements, from proposal and design through commissioning, and Eisenmann brings advanced automation and low-environmental-impact process technology that complements the group's existing automotive-line business. Read against the segment data, the logic is plain — Europe generated only ¥8,609 million of revenue this half, about 2.4% of the external total, easily the group's weakest region. Goodwill, acquisition-related costs and the fair values of the assets and liabilities assumed were all undetermined at the filing date, and none of the transaction appears in the first-half profit and loss.
Guidance raised — but check the currency assumption before the applause
Daifuku lifted every full-year line from the forecast it published on February 12, 2026. Revenue goes to ¥735,000 million from ¥700,000 million, up 5.0% against the old forecast and 11.2% year on year. Operating profit goes to ¥113,000 million from ¥105,000 million, up 7.6% and 12.1%. Ordinary profit goes to ¥116,500 million from ¥108,500 million, up 7.4% and 11.3%. Net profit attributable to owners of parent goes to ¥86,500 million from ¥80,000 million, up 8.1% and 10.8%, for EPS of ¥233.55 against ¥217.57.
The company also discloses what did the lifting. It revised its US dollar assumption for the year from ¥150 to ¥158, and states that this revision alone accounts for ¥30.0 billion of the order increase, ¥24.0 billion of the revenue increase and ¥4.0 billion of the operating-profit increase. Against a ¥35.0 billion revenue upgrade, that is about 69% currency. Against an ¥8.0 billion operating-profit upgrade, it is exactly half. The non-currency remainder is attributed to semiconductor-line projects progressing well out of the year-end backlog, some revenue recognition pulled forward, and improved profitability from production efficiency and better project management. The same test applied to the order guidance: ¥30.0 billion of the ¥80.0 billion increase at each end of the range is the exchange-rate assumption.
The implied second half is more sober than the headline. Guidance minus first-half actuals leaves revenue of ¥379,487 million and operating profit of ¥56,320 million — an H2 operating margin of 14.8% against 15.9% in the first half. The company is guiding for margin to give some ground as the larger projects convert, which is consistent with the SG&A trend described above. On geopolitics the disclosure is short and specific: Daifuku has no production or sales base in the Middle East and destination revenue there is under 0.1% of prior-year consolidated revenue, so direct exposure is minimal; the risk it flags is indirect, through crude prices and logistics disruption raising costs on projects already booked, and through customers deferring capital plans.
The dividend was raised alongside. The interim dividend is ¥40.00 per share against ¥34.00, payable from September 3, 2026, and the year-end forecast is ¥50.00 against ¥44.00, for a full-year total of ¥90.00 against ¥78.00 — up 15.4%, and itself a revision upward from the previously announced forecast. Against guided EPS of ¥233.55 that is a payout ratio of about 38.5%. The dividend is rising faster than guided net profit, which is up 10.8%; on a half that was substantially a currency event, the cash return is the least ambiguous part of it.
| Metric | H1 FY12/2026 | H1 FY12/2025 | Change |
|---|---|---|---|
| Orders received (¥ million) | 440,186 | ≈334,500 | +31.6% |
| Revenue (¥ million) | 355,513 | 326,489 | +8.9% |
| Gross profit (¥ million) | 92,469 | 79,756 | +15.9% |
| Gross margin | 26.0% | 24.4% | +1.6 pt |
| SG&A expenses (¥ million) | 35,789 | 28,653 | +24.9% |
| Operating profit (¥ million) | 56,680 | 51,103 | +10.9% |
| Operating margin | 15.9% | 15.7% | +0.3 pt |
| Ordinary profit (¥ million) | 58,666 | 52,523 | +11.7% |
| Net profit attrib. to owners of parent (¥ million) | 43,143 | 37,623 | +14.7% |
| Comprehensive income (¥ million) | 50,612 | 24,757 | +104.4% |
| EPS (¥) | 117.07 | 102.32 | +14.4% |
| Diluted EPS (¥) | 111.85 | 97.58 | +14.6% |
| Operating cash flow (¥ million) | 52,064 | 44,350 | +17.4% |
| Cash and equivalents, period-end (¥ million) | 258,764 | 229,828 | +12.6% |
| Total assets (¥ million) | 803,181 | 754,211 | +6.5% |
| Net assets (¥ million) | 501,690 | 451,560 | +11.1% |
| Equity ratio | 62.5% | 59.9% | +2.6 pt |
| Interim dividend per share (¥) | 40.00 | 34.00 | +17.6% |
| Full-year dividend per share (¥, forecast) | 90.00 | 78.00 | +15.4% |
| Metric | New forecast | Previous forecast | Change |
|---|---|---|---|
| Revenue (¥ million) | 735,000 | 700,000 | +5.0% |
| Operating profit (¥ million) | 113,000 | 105,000 | +7.6% |
| Ordinary profit (¥ million) | 116,500 | 108,500 | +7.4% |
| Net profit attrib. to owners of parent (¥ million) | 86,500 | 80,000 | +8.1% |
| EPS (¥) | 233.55 | 217.57 | +7.3% |
| Orders received (¥ million) | 860,000–900,000 | 780,000–820,000 | +80,000 |
| USD assumption (¥) | 158 | 150 | +8 |
JapanStockPulse provides informational content only and does not constitute investment advice. Figures are taken from the company's published earnings short report and may be subject to subsequent revision.