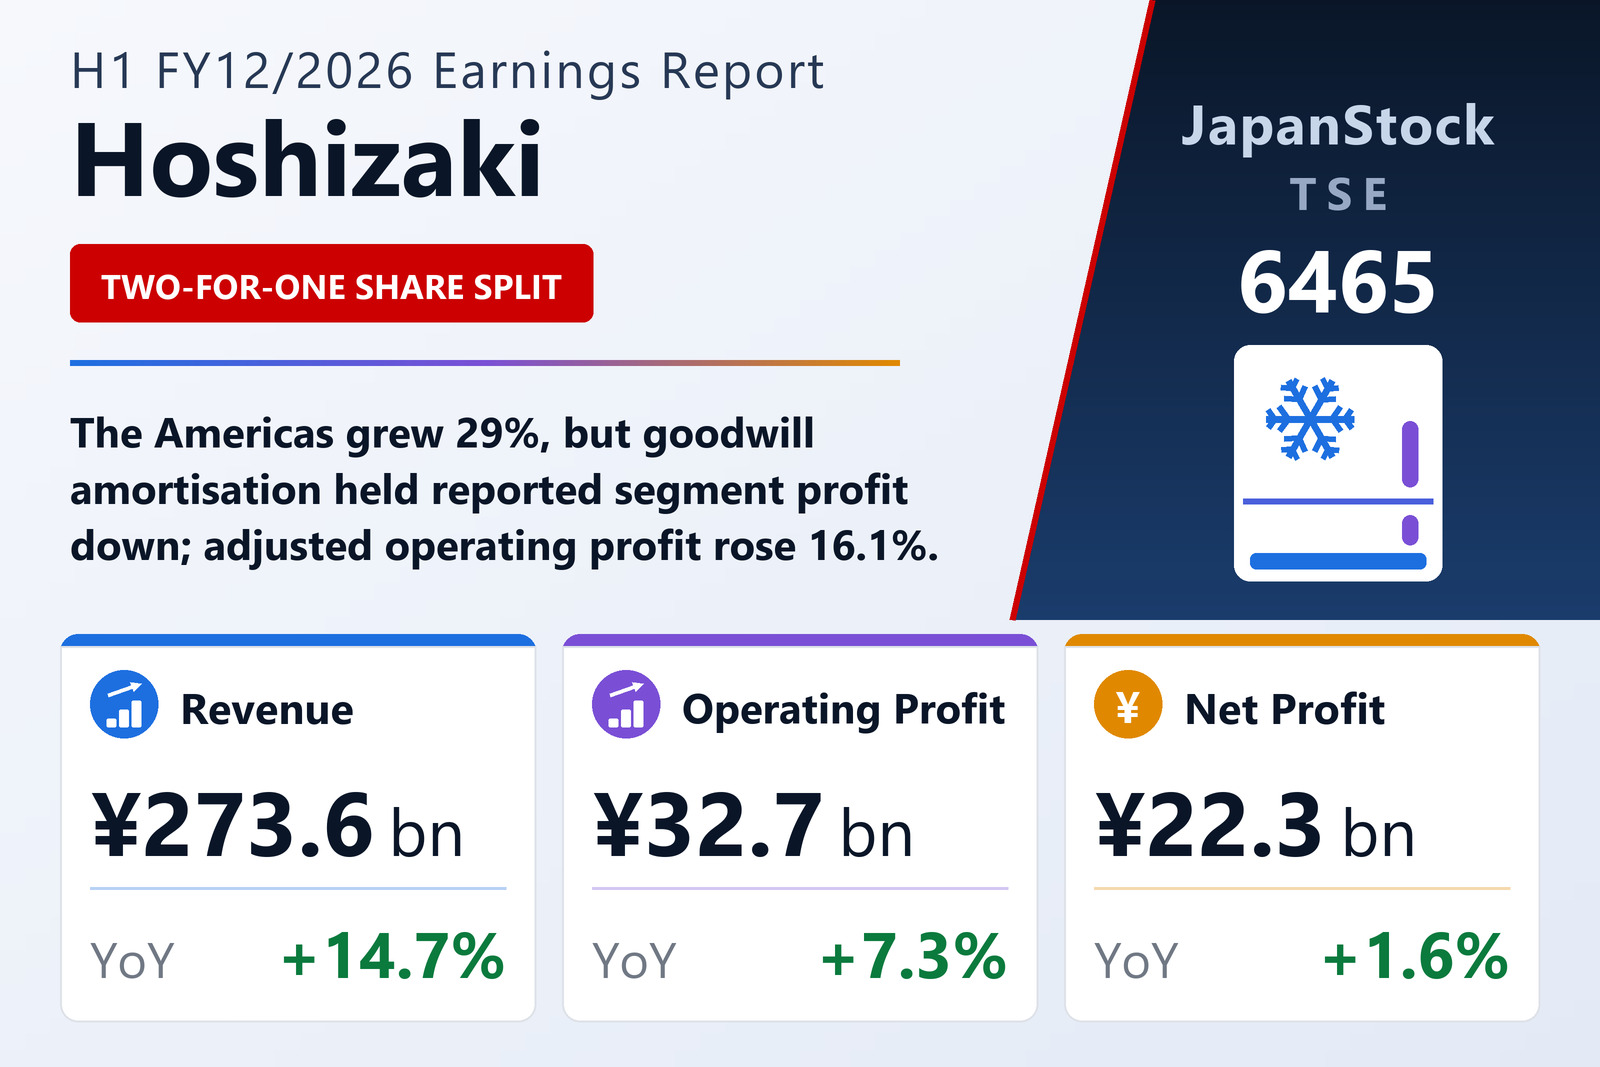
Revenue up 14.7%, net profit up 1.6% — the gap is the story
Hoshizaki Corporation (TSE: 6465), the Aichi-based maker of commercial ice machines, refrigerators and freezers, dishwashers and beverage dispensers for restaurants, hotels and retailers, published consolidated results for the first half of the year to December 2026 — the six months from January 1 to June 30, 2026 — under Japanese GAAP on August 6, 2026. Revenue rose 14.7% to ¥273,646 million from ¥238,528 million, well ahead of the 9.4% the company managed in the same period a year earlier. Nothing below it kept pace. Operating profit rose 7.3% to ¥32,705 million, ordinary profit 6.9% to ¥34,053 million, and net profit attributable to owners of parent just 1.6%, to ¥22,297 million.
Three separate compressions produce that funnel, and they are worth separating because only one of them is a cash cost. The first is gross margin. Cost of sales rose 15.6% to ¥170,566 million, marginally faster than revenue, so gross profit rose 13.3% to ¥103,080 million and the gross margin narrowed to 37.7% from 38.1%. The second is operating cost. Selling, general and administrative expenses rose 16.3% to ¥70,374 million — the fastest-growing line on the statement — adding ¥9,856 million of cost against ¥12,081 million of added gross profit. What survives is ¥2,225 million of incremental operating profit and an operating margin of 12.0%, down from 12.8%. The third compression is tax, and it is dealt with below.
Adjusted operating profit: the ¥6.6 billion the acquisitions cost
Alongside operating profit Hoshizaki discloses an "adjusted operating profit": operating profit before amortisation of the investment differential arising on business combinations — goodwill plus the intangible assets recognised on acquisition — and before the effect of hyperinflation accounting. On that measure first-half profit rose 16.1% to ¥39,330 million from ¥33,886 million, slightly ahead of the 14.7% revenue gain, and the adjusted operating margin widened to 14.4% from 14.2%. Two measures of the same six months, growing at 7.3% and 16.1%.
The distance between them is ¥6,625 million this half against ¥3,406 million a year ago — the add-backs roughly doubled. ¥4,567 million of it is amortisation of acquisition goodwill and intangibles, against ¥1,627 million; ¥2,056 million is the hyperinflation adjustment, against ¥1,778 million. The second item is a Turkish matter rather than a group-wide one: cumulative three-year inflation in Turkey has passed 100%, so the group restates its Turkish subsidiary under IAS 29 before consolidating it, and the amount added back here is the hyperinflation effect on that subsidiary's goodwill and intangible amortisation.
Whether 7.3% or 16.1% is the honest number depends on how you treat the amortisation. It is non-cash, it is fixed in size, and it will eventually run off. It is also the accounting record of cash the company genuinely paid for businesses that are now producing the revenue growth being celebrated on the top line. The one thing not in dispute is where the charge sits — and it sits almost entirely in one place.
The Americas is the entire divergence
One presentational change matters before the numbers. From this period, amortisation of acquisition goodwill and intangibles — previously carried in the unallocated adjustment line — is charged to the individual reportable segments, and the prior-year segment figures below have been restated on that basis. Segment revenue includes intersegment sales.
Americas was the fastest-growing segment and the only one whose reported profit fell. Revenue rose 29.3% to ¥74,773 million; reported segment profit fell 16.8% to ¥4,764 million; adjusted operating profit rose 33.3% to ¥7,636 million. The whole of that ¥2,871 million gap is amortisation on the business Hoshizaki acquired in the prior fiscal year — against zero a year earlier, when the segment's reported and adjusted profit were the same ¥5,728 million. The Americas is now 27.1% of external revenue, up from 24.1%, and it is single-handedly responsible for the difference between the group's 7.3% and 16.1% operating-profit growth rates.
Europe shows the same effect in more extreme form. Revenue rose 10.5% to ¥30,352 million and reported segment profit rose 89.2% — to ¥375 million, which is 1.2% of segment revenue. Adjusted operating profit was ¥3,525 million, up 15.5%, an 11.6% margin. Between the two sit ¥1,093 million of amortisation and the ¥2,056 million Turkish hyperinflation effect. On a reported basis Europe barely earns anything; on an adjusted basis it is a normally profitable business carrying two large non-cash charges.
Japan remains the engine: revenue up 6.2% to ¥126,318 million, segment profit up 11.1% to ¥19,534 million, adjusted operating profit up 11.1% to ¥19,598 million — only ¥63 million between the two, because Japan carries almost no acquisition amortisation. Japan produced 59.8% of total segment profit on 45.2% of segment revenue, at a 15.5% margin against 14.8% a year earlier. The company is pushing beyond its core restaurant market into hotels, retail and distribution, selling natural-refrigerant (non-fluorocarbon) refrigerators, ice machines and dishwashers, and reports rising repair and maintenance demand alongside inbound-tourism-driven capital investment.
Asia is the highest-margin segment: revenue up 21.8% to ¥47,986 million, segment profit up 25.0% to ¥7,984 million — a 16.6% margin — and adjusted operating profit up 23.9% to ¥8,523 million, led by strong refrigerator sales in India.
The product breakdown makes the acquisition visible from the other direction. Refrigerators are now the largest single product line at ¥87,075 million, up 34.8%, and the reason is that Americas refrigerator revenue more than tripled, to ¥19,990 million from ¥6,334 million. Ice machines rose 12.2% to ¥50,932 million; maintenance and repair — the recurring, installed-base revenue — rose 13.9% to ¥39,365 million; dishwashers rose 5.1% to ¥18,774 million. Two lines went backwards: dispensers fell 1.6% to ¥20,193 million and merchandise purchased from other manufacturers fell 2.5% to ¥24,276 million.
Why net profit grew only 1.6%: the tax line
Below the operating line almost nothing changed. Non-operating income was ¥3,250 million against ¥3,434 million, non-operating expenses ¥1,901 million against ¥2,061 million, leaving ordinary profit at ¥34,053 million, up 6.9%. Extraordinary items were trivial on both sides — ¥160 million of gains, ¥47 million of losses — so pre-tax interim profit was ¥34,166 million, up 7.1%.
The growth then disappears into tax. The total charge was ¥11,499 million against ¥9,666 million, up 19.0% on a 7.1% rise in pre-tax profit, lifting the effective rate to 33.7% from 30.3% — 3.4 percentage points. The direction is what the segment analysis would predict: goodwill amortisation recognised only at the consolidation level is generally not deductible, so a charge that more than doubled mechanically raises the consolidated effective rate. The company does not publish a tax reconciliation in an interim tanshin, so the attribution is inference rather than disclosure, but the arithmetic leaves little else to blame. After ¥368 million to non-controlling interests, net profit attributable to owners of parent was ¥22,297 million, up 1.6%, for a net margin of 8.1% against 9.2%.
Earnings per share came to ¥159.04 from ¥155.17, up 2.5% — ahead of the 1.6% profit gain because the weighted average share count fell to 140,206,041 from 141,470,077 on the buyback described below. There are no potential dilutive shares, so no diluted figure is reported.
Comprehensive income tells a completely different story: ¥32,737 million against ¥4,260 million, up 668.4%. Almost all of the swing is currency translation — a positive ¥10,267 million this half against a negative ¥17,576 million a year ago, a ¥27,843 million turn. That is a translation effect on the group's overseas net assets, not trading performance, and it should be read separately from the ¥22,297 million the business itself earned.
The balance sheet: receivables build, buybacks shrink equity, translation restores it
Total assets reached ¥595,210 million at June 30, 2026, up ¥19,563 million from December 31, 2025. Current assets rose ¥9,004 million to ¥351,318 million, and the composition is the working-capital cost of 14.7% growth: notes and accounts receivable and contract assets rose ¥12,185 million to ¥88,921 million, while cash and deposits fell ¥7,677 million to ¥169,412 million. Non-current assets rose ¥10,558 million to ¥243,891 million, chiefly investments and other assets, up ¥6,603 million to ¥47,227 million, and property, plant and equipment, up ¥4,981 million to ¥96,611 million.
Goodwill actually fell, to ¥75,400 million from ¥76,352 million, because amortisation outran the favourable currency translation. Goodwill and intangibles together stand at ¥100,052 million — 16.8% of total assets. That is the balance-sheet reason the amortisation line is as large as it is, and a rough measure of how long it will keep running against reported profit.
Total liabilities rose ¥12,802 million to ¥174,533 million. Current liabilities rose ¥18,534 million to ¥154,133 million, led by income taxes payable, up ¥6,223 million to ¥12,010 million, alongside contract liabilities and trade payables. Non-current liabilities fell ¥5,732 million to ¥20,400 million, almost entirely because the retirement benefit liability dropped to ¥2,273 million from ¥6,580 million after the group contributed ¥4,325 million to a retirement benefit trust.
Net assets rose ¥6,761 million to ¥420,676 million — but the composition inverts the usual pattern. Shareholders' equity actually fell ¥4,461 million, to ¥317,581 million: retained earnings added ¥13,094 million, and treasury stock subtracted ¥17,049 million. The whole of the increase, and more, came from accumulated other comprehensive income, up ¥10,651 million to ¥81,216 million, of which the foreign currency translation adjustment alone is ¥10,527 million. The equity ratio slipped to 67.0% from 68.2% while net assets per share rose 4.0% to ¥2,884.10 from ¥2,772.73 — the per-share figure flattered by a smaller denominator, since shares outstanding net of treasury fell to 138,274,520.
Cash flow: ¥29.1 billion generated, ¥26.4 billion handed back
Operating cash flow more than doubled, to ¥29,098 million from ¥13,541 million. Pre-tax profit contributed ¥34,166 million, depreciation ¥6,200 million and goodwill amortisation ¥3,782 million — the last against just ¥807 million a year ago, which is the same acquisition showing up as a cash-flow add-back. Working capital still absorbed cash, but far less: trade receivables and contract assets took ¥11,528 million against ¥15,726 million, and inventories ¥1,493 million against ¥6,073 million, roughly ¥8.8 billion less absorption than a year earlier. Income tax paid was ¥8,642 million, essentially flat against ¥8,611 million.
Investing used ¥5,184 million against ¥10,610 million. The gross outflows were larger than the net figure suggests — ¥5,627 million on investment securities and ¥5,399 million of capital expenditure on property, plant and equipment — but ¥8,056 million of maturing time deposits, net of ¥2,660 million placed, and ¥2,046 million of securities sales offset most of it. Free cash flow, taking operating less investing, was ¥23,914 million against ¥2,931 million.
Financing used ¥30,695 million against ¥7,747 million, and this is where the cash went. Treasury share purchases took ¥17,206 million — the company bought 3,348,000 shares under a February 13, 2026 board resolution — with a further ¥2,000 million deposited for future acquisitions, ¥9,202 million of dividends, ¥1,787 million to buy subsidiary shares from non-controlling interests, and ¥495 million of lease repayments. Buybacks and dividends together came to ¥26,408 million against ¥22,297 million of net profit — a 118% payout of half-year earnings. Treasury stock on the balance sheet rose ¥17,049 million to ¥35,577 million, and treasury shares held reached 6,615,580 out of 144,890,100 issued. Cash and equivalents ended the half at ¥157,360 million, down ¥2,082 million, after a ¥2,945 million favourable translation difference and a ¥1,754 million hyperinflation effect.
Guidance unchanged, dividend unchanged — and a 2-for-1 split
Full-year FY12/2026 guidance is unchanged from the February 13, 2026 forecast: revenue of ¥520,000 million, up 7.0%; operating profit of ¥55,600 million, up 7.1%; adjusted operating profit of ¥68,200 million, up 11.6%; ordinary profit of ¥59,000 million, up 4.8%; and net profit attributable to owners of parent of ¥38,200 million, up 0.1%, for EPS of ¥274.20. That EPS excludes the effect of any repurchases made from July 1, 2026 onward under the February resolution.
Leaving those numbers alone after this first half is a decision, not a formality. The half delivered 52.6% of the full-year revenue target but 58.8% of the operating-profit target and 58.4% of the net-profit target. Holding guidance therefore implies a materially weaker second half: ¥246,354 million of revenue and ¥22,895 million of operating profit, both below what the first half produced, at an implied operating margin of 9.3% against 12.0%. On the adjusted measure the implied second half is ¥28,870 million, an 11.7% margin against 14.4%. On net profit the implied second half is ¥15,903 million against ¥22,297 million booked. Either management expects the acquisition amortisation and competitive pressure to bite harder, or the forecast is simply conservative and will be revised.
The dividend is also unchanged in total but not in shape. FY12/2026 pays an interim of ¥55.00, up from ¥50.00, with payment starting September 14, 2026, and a forecast year-end of ¥60.00, down from ¥65.00 — a full-year ¥115.00, identical to FY12/2025. On guided EPS of ¥274.20 that is a 41.9% payout ratio, before buybacks.
The genuinely new item is the 2-for-1 stock split resolved at the same August 6, 2026 board meeting. Each common share becomes two, with a record date of December 31, 2026 (effectively December 30, as the shareholder registry agent is closed) and an effective date of January 1, 2027. Shares outstanding go from 144,890,100 to 289,780,200, and Article 6 of the articles of incorporation is amended under Article 184(2) of the Companies Act to double the authorised share count from 500,000,000 to 1,000,000,000, effective the same day. Stated capital is unchanged. The stated purpose is to lower the investment unit, improve liquidity and broaden the shareholder base. Restated as if the split had occurred at the start of the prior fiscal year, interim EPS would be ¥79.52 against ¥77.59. Because the split takes effect on January 1, 2027, the FY12/2026 year-end dividend of ¥60.00 is still a pre-split figure.
One further subsequent event, resolved on June 16 and executed on July 9, 2026, is arguably the more consequential: Hoshizaki disposed of 2,329,100 treasury shares at ¥5,196 each — ¥12,102,003,600 in total — by third-party allotment to two funds, Japan Activation Capital I L.P. (554,000 shares) and Japan Activation Capital II Alpha L.P. (1,775,100 shares). The company frames it as a strategic alliance ahead of a new medium-term plan starting in 2027 whose priorities are capital efficiency, profitability and corporate-value improvement. Counting shares also bought from existing holders, funds managed or advised by Japan Activation Capital hold about 2.7% of Hoshizaki after the transaction. Read next to ¥17.2 billion of buybacks, a doubling of the share count and an unchanged dividend, the capital-policy agenda for 2027 is not being kept a secret.
Management's own framing of conditions is measured. Japan is in a gradual recovery, supported by entrenched high wage settlements, resilient service consumption and steady inbound demand, against persistent inflation and labour shortage. Abroad, India keeps growing while US policy uncertainty, European and Chinese stagnation and heightened Middle East geopolitical risk cloud the outlook; the company notes that the IMF's July 2026 world economic outlook cut 2026 global growth to 3.0% from 3.1%.
| Metric | H1 FY12/2026 | H1 FY12/2025 | Change |
|---|---|---|---|
| Revenue (¥ million) | 273,646 | 238,528 | +14.7% |
| Gross profit (¥ million) | 103,080 | 90,999 | +13.3% |
| Gross margin | 37.7% | 38.1% | −0.5 pt |
| SG&A expenses (¥ million) | 70,374 | 60,518 | +16.3% |
| Operating profit (¥ million) | 32,705 | 30,480 | +7.3% |
| Operating margin | 12.0% | 12.8% | −0.8 pt |
| Adjusted operating profit (¥ million) | 39,330 | 33,886 | +16.1% |
| Adjusted operating margin | 14.4% | 14.2% | +0.2 pt |
| Ordinary profit (¥ million) | 34,053 | 31,854 | +6.9% |
| Pre-tax interim profit (¥ million) | 34,166 | 31,908 | +7.1% |
| Income taxes (¥ million) | 11,499 | 9,666 | +19.0% |
| Effective tax rate | 33.7% | 30.3% | +3.4 pt |
| Net profit attrib. to owners of parent (¥ million) | 22,297 | 21,952 | +1.6% |
| Net margin | 8.1% | 9.2% | −1.1 pt |
| Comprehensive income (¥ million) | 32,737 | 4,260 | +668.4% |
| EPS (¥) | 159.04 | 155.17 | +2.5% |
| EPS restated for the 2-for-1 split (¥) | 79.52 | 77.59 | +2.5% |
| Japan — revenue (¥ million) | 126,318 | 118,950 | +6.2% |
| Japan — segment profit (¥ million) | 19,534 | 17,584 | +11.1% |
| Japan — adjusted operating profit (¥ million) | 19,598 | 17,647 | +11.1% |
| Americas — revenue (¥ million) | 74,773 | 57,811 | +29.3% |
| Americas — segment profit (¥ million) | 4,764 | 5,728 | −16.8% |
| Americas — adjusted operating profit (¥ million) | 7,636 | 5,728 | +33.3% |
| Europe — revenue (¥ million) | 30,352 | 27,471 | +10.5% |
| Europe — segment profit (¥ million) | 375 | 198 | +89.2% |
| Europe — adjusted operating profit (¥ million) | 3,525 | 3,051 | +15.5% |
| Asia — revenue (¥ million) | 47,986 | 39,392 | +21.8% |
| Asia — segment profit (¥ million) | 7,984 | 6,388 | +25.0% |
| Asia — adjusted operating profit (¥ million) | 8,523 | 6,877 | +23.9% |
| Total assets (¥ million) | 595,210 | 575,646 | +3.4% |
| Net assets (¥ million) | 420,676 | 413,914 | +1.6% |
| Equity ratio | 67.0% | 68.2% | −1.2 pt |
| Net assets per share (¥) | 2,884.10 | 2,772.73 | +4.0% |
| Operating cash flow (¥ million) | 29,098 | 13,541 | +114.9% |
| Investing cash flow (¥ million) | −5,184 | −10,610 | +5,426 |
| Financing cash flow (¥ million) | −30,695 | −7,747 | −22,948 |
| Cash and equivalents, period end (¥ million) | 157,360 | 159,442 | −1.3% |
| Interim dividend per share (¥) | 55.00 | 50.00 | +10.0% |
| Full-year dividend forecast per share (¥) | 115.00 | 115.00 | Unchanged |
JapanStockPulse provides informational content only and does not constitute investment advice. Figures are taken from the company's published earnings short report and may be subject to subsequent revision.