Every segment grew revenue; only one lost profit
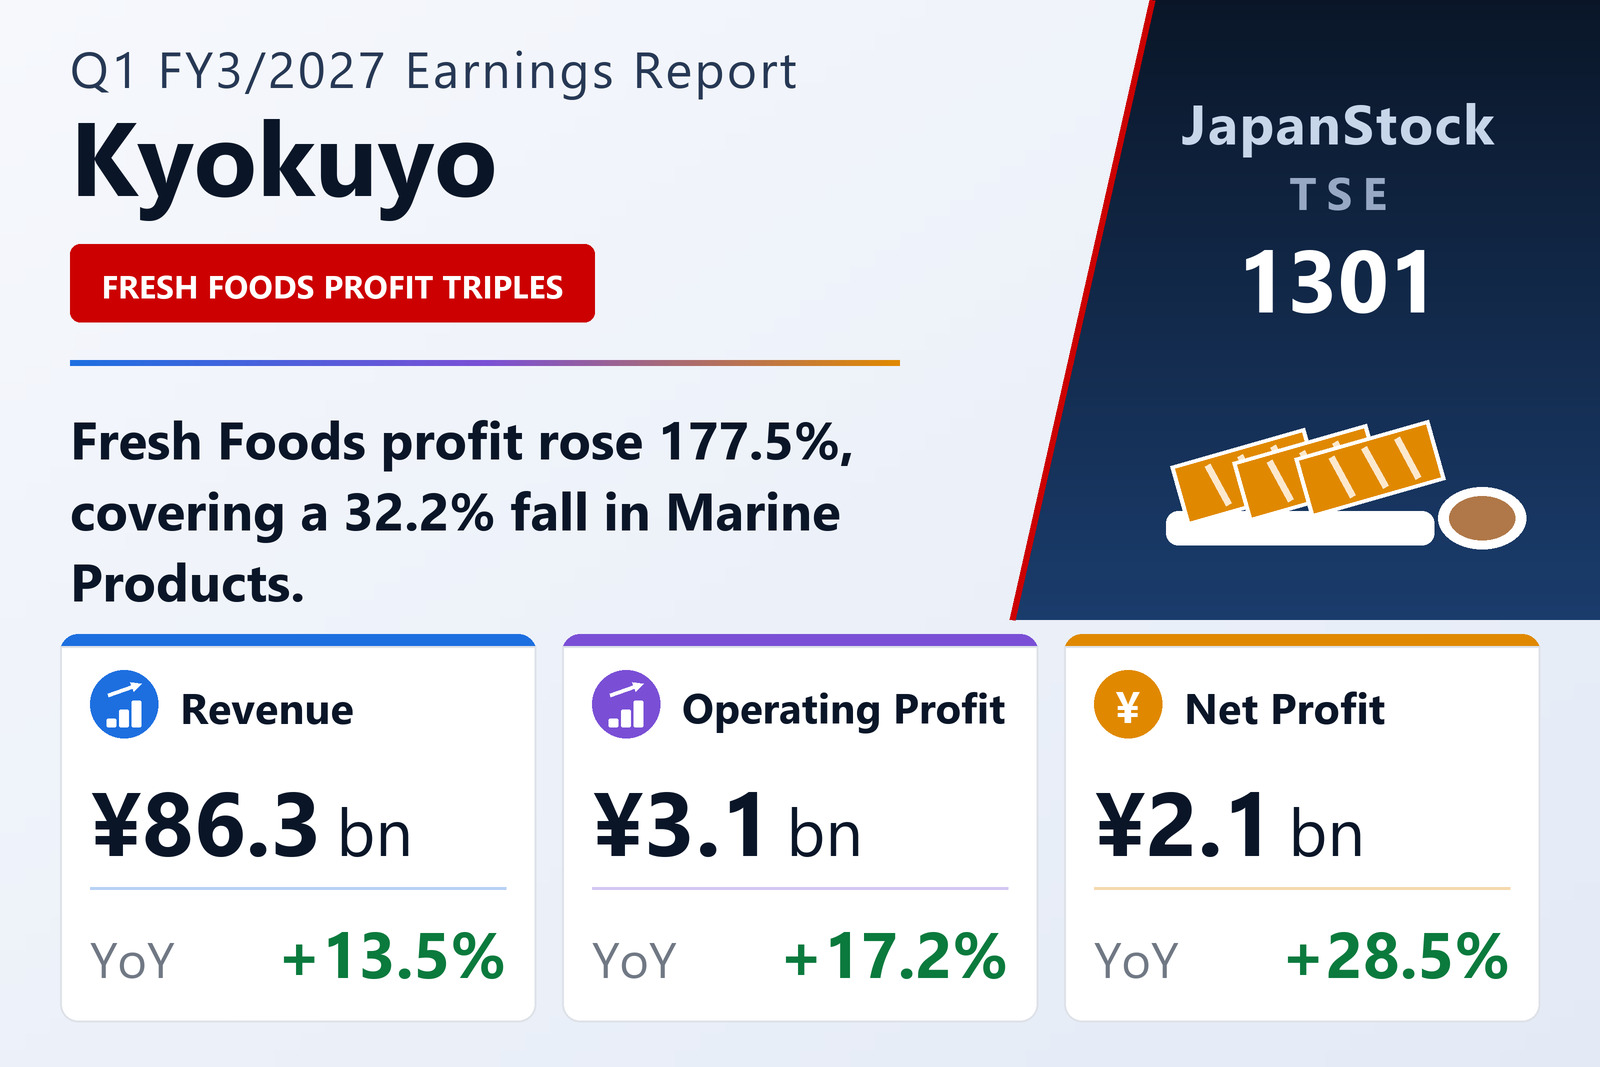
Kyokuyo Co., Ltd. (TSE: 1301) published consolidated results for the three months to June 30, 2026 on August 7, 2026 under Japanese GAAP. Net sales rose 13.5% to ¥86,287 million, operating profit 17.2% to ¥3,057 million, ordinary profit 21.7% to ¥2,987 million and net profit attributable to owners of the parent 28.5% to ¥2,143 million, for earnings per share of ¥180.48 against ¥140.42.
Kyokuyo redefined its reportable segments this quarter, following a review of internal management divisions; prior-year figures are restated on the new basis, so the comparisons below are like-for-like. The group now reports Marine Products, Marine Processing, Fresh Foods, Processed Foods and Logistics Services.
The swing between the two largest segments
Marine Products is the largest at ¥42,826 million of external revenue, up 15.8%, but its segment profit fell 32.2% to ¥1,059 million. The company explains the split within it: on domestic sales, with marine-product market prices running high, the main species — salmon and shrimp — grew sales but earned less on them, while fish roe, a high-value line, progressed as planned and gained on both revenue and profit.
Fresh Foods did the opposite: revenue up 17.9% to ¥21,450 million and segment profit up 177.5% to ¥1,640 million, a gain of ¥1,049 million that on its own more than covers the ¥504 million Marine Products gave up. Marine Processing lifted profit 38.1% to ¥337 million, Processed Foods 9.8% to ¥562 million and Logistics Services 12.7% to ¥89 million. Unallocated corporate costs took ¥688 million off the total.
A tough backdrop, stated plainly
The company describes the seafood and food industry as operating in difficult conditions: inbound demand below the prior year, rising raw-material prices and prolonged inflation keeping consumers thrift-minded. Against that it is running the final year of its medium-term plan Gear Up Kyokuyo 2027 (FY2024-FY2026), under a corporate purpose of moving toward "a sustainable world in which food, centred on fish, stands close to people, daily life and the planet", strengthening its business base, financial base and stakeholder partnerships.
Balance sheet and guidance
Total assets edged down 0.7% from the March year-end to ¥212,526 million while net assets rose 1.4% to ¥79,978 million, lifting the equity ratio to 37.2% from 36.1%. Comprehensive income was ¥2,795 million against ¥3,253 million — below net profit, the reverse of the usual pattern. Kyokuyo (Thailand) Co., Ltd. left the scope of consolidation during the quarter.
Guidance for FY3/2027 is unchanged: net sales of ¥365,000 million (+9.1%), operating profit of ¥12,000 million (+11.8%), ordinary profit of ¥11,000 million (+9.7%) and net profit of ¥7,200 million (+5.2%), for earnings per share of ¥606.20. The quarter delivered 25.5% of the full-year operating-profit target. The annual dividend forecast rises to ¥160.00 per share from ¥150.00, paid entirely at the year-end.
| Metric | Q1 FY3/2027 | Q1 FY3/2026 | Change |
|---|---|---|---|
| Net sales (¥ million) | 86,287 | 76,030 | +13.5% |
| Operating profit (¥ million) | 3,057 | 2,607 | +17.2% |
| Operating margin | 3.5% | 3.4% | +0.1 pt |
| Ordinary profit (¥ million) | 2,987 | 2,455 | +21.7% |
| Net profit attrib. to owners of parent (¥ million) | 2,143 | 1,667 | +28.5% |
| Comprehensive income (¥ million) | 2,795 | 3,253 | −14.1% |
| EPS (¥) | 180.48 | 140.42 | +28.5% |
| Marine Products — revenue (¥ million) | 42,826 | 36,978 | +15.8% |
| Marine Products — segment profit (¥ million) | 1,059 | 1,563 | −32.2% |
| Marine Processing — revenue (¥ million) | 6,641 | 6,057 | +9.6% |
| Marine Processing — segment profit (¥ million) | 337 | 244 | +38.1% |
| Fresh Foods — revenue (¥ million) | 21,450 | 18,199 | +17.9% |
| Fresh Foods — segment profit (¥ million) | 1,640 | 591 | +177.5% |
| Processed Foods — revenue (¥ million) | 14,773 | 14,241 | +3.7% |
| Processed Foods — segment profit (¥ million) | 562 | 512 | +9.8% |
| Logistics Services — revenue (¥ million) | 468 | 412 | +13.6% |
| Logistics Services — segment profit (¥ million) | 89 | 79 | +12.7% |
| Total assets (¥ million) | 212,526 | 214,128 | −0.7% |
| Net assets (¥ million) | 79,978 | 78,868 | +1.4% |
| Equity ratio | 37.2% | 36.1% | +1.1 pt |
| FY3/2027 guidance — revenue (¥ million) | 365,000 | — | +9.1% |
| FY3/2027 guidance — operating profit (¥ million) | 12,000 | — | +11.8% |
| FY3/2027 guidance — ordinary profit (¥ million) | 11,000 | — | +9.7% |
| FY3/2027 guidance — net profit (¥ million) | 7,200 | — | +5.2% |
| FY3/2027 guidance — EPS (¥) | 606.20 | — | n.m. |
| Annual dividend per share (¥) | 160.00 | 150.00 | +6.7% |
JapanStockPulse provides informational content only and does not constitute investment advice. Figures are taken from the company's published earnings short report and may be subject to subsequent revision.