Revenue up 10.7%, cost of sales up 2.9% — the whole result is in that gap
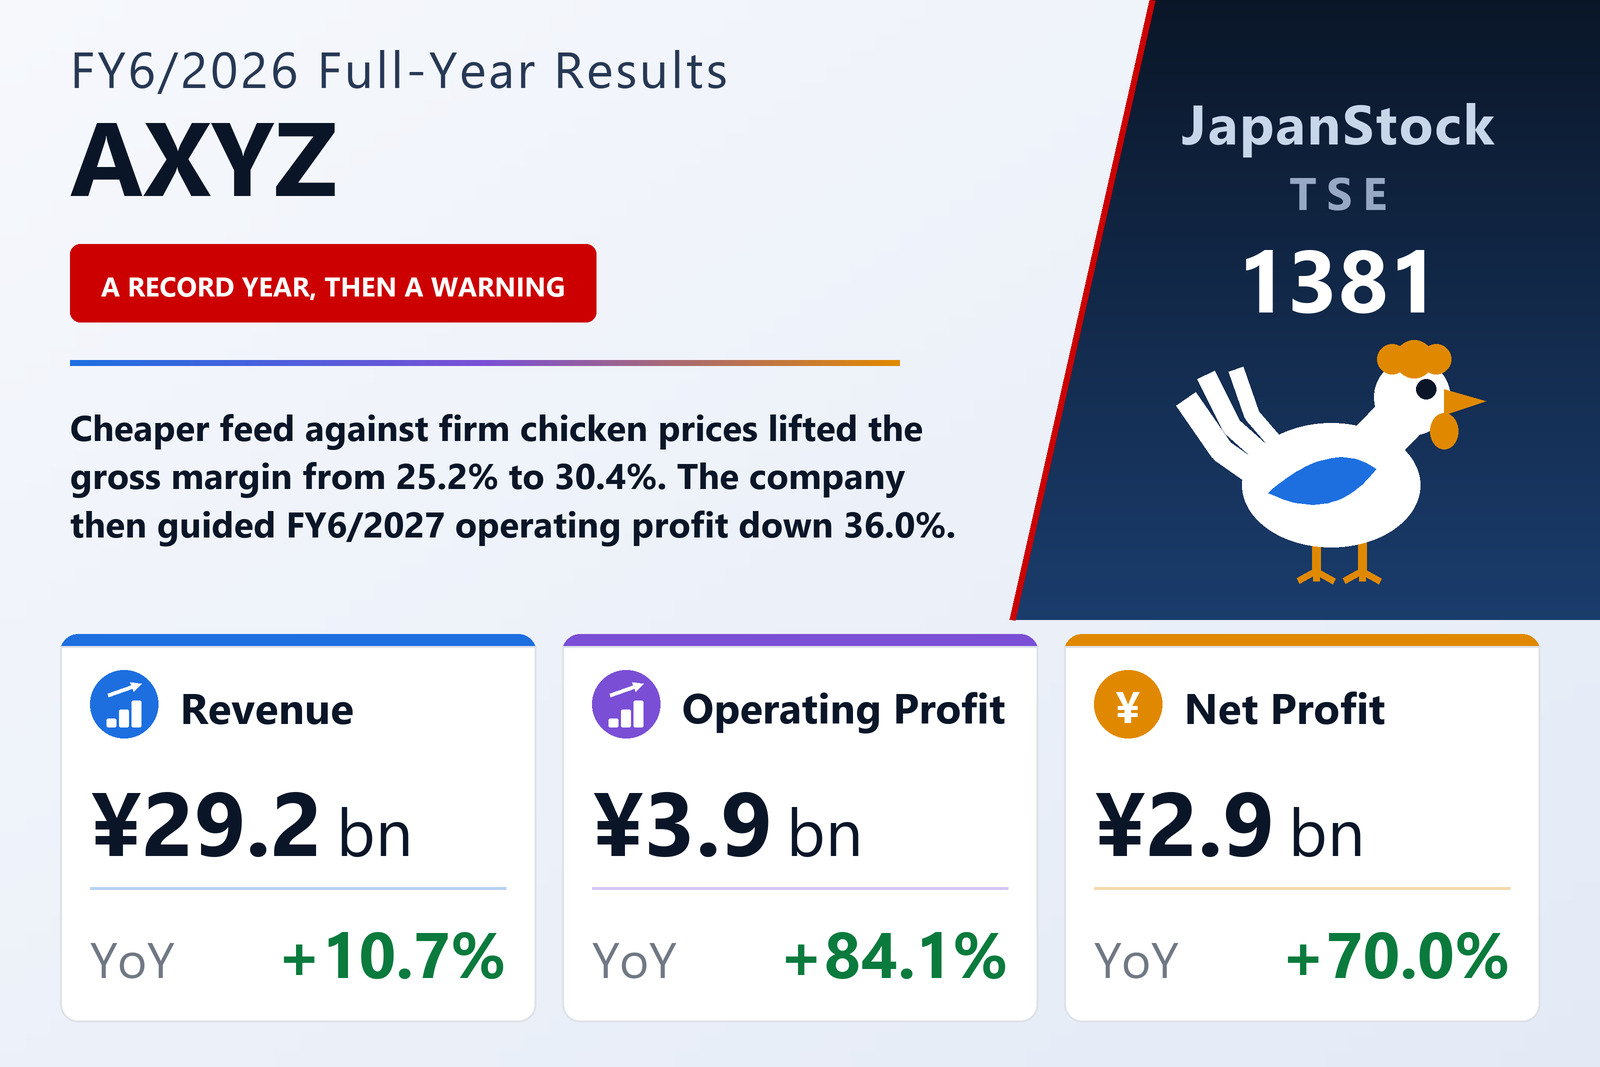
AXYZ Co., Ltd. (TSE: 1381), the Kagoshima-based broiler-chicken producer that keeps feed manufacture, rearing, chicken production and processing inside a single group, published consolidated results for the year to June 30, 2026 on August 7, 2026 under Japanese GAAP. Revenue rose 10.7% to ¥29,244 million. Cost of sales rose 2.9% to ¥20,343 million. Gross profit therefore rose 33.6% to ¥8,901 million and the gross margin widened from 25.2% to 30.4%.
Selling, general and administrative expenses rose 10.0% to ¥4,996 million, roughly in line with revenue, so almost the whole of the gross-profit gain fell through to the operating line: operating profit rose 84.1% to ¥3,905 million and ordinary profit 88.7% to ¥4,098 million. The disclosed operating margin went from 8.0% to 13.4%, return on equity from 8.1% to 12.8%, and ordinary profit to total assets from 8.8% to 15.3%. The filing states the reason on the cost side plainly: feed-grain prices, the main production cost in this industry, have been easing gradually, while other production costs including personnel have kept rising.
Food is 84% of revenue and it more than doubled its profit
The Food segment turned over ¥24,674 million, up 11.2%, and its segment profit rose 121.7% to ¥3,332 million. The company attributes the revenue growth to sales to major customers running smoothly and to chicken market prices holding firm through the year, and the profit growth to operational efficiency and cost reductions. Capital investment in renovating rearing facilities — aimed at future capacity increases as well as at efficiency and labour saving — is being carried out in stages to build an expanded production system.
The two smaller businesses went the other way on profit. Restaurants turned over ¥4,112 million, up 9.3%, but segment profit fell 13.1% to ¥230 million, which the filing attributes to front-loaded costs at new stores together with increases in raw-material and personnel costs. Energy turned over ¥457 million, down 4.0%, with segment profit of ¥341 million, down 2.9%. Food is roughly 84% of group revenue, so the group result is very close to the Food result.
Below the operating line, last year's securities gain narrows the gap
Pre-tax profit rose 61.5% to ¥4,093 million — a smaller increase than ordinary profit's 88.7%, and the reason sits in the prior year rather than this one. FY6/2025 carried a ¥371 million gain on the sale of investment securities alongside a ¥9 million impairment loss; FY6/2026 carried no extraordinary gains at all and an impairment loss of ¥5 million. The equity-method investment result was a loss of ¥1 million against a loss of ¥15 million. Income taxes rose 43.7% to ¥1,168 million, and profit attributable to owners of the parent rose 70.0% to ¥2,925 million, or ¥520.91 per share against ¥306.43. Comprehensive income more than doubled, rising 117.6% to ¥3,115 million.
Cash built up and the balance sheet is almost all equity
Total assets rose 13.5% to ¥28,461 million and net assets 11.5% to ¥24,084 million. Because assets grew faster than equity, the equity ratio slipped from 86.1% to 84.6% — a level at which the company is financed almost entirely by its own capital either way. Net assets per share rose 11.5% to ¥4,288.83.
Operating cash flow rose to ¥4,885 million from ¥2,915 million, well ahead of the ¥2,925 million of net profit. Investing outflows were ¥1,534 million against ¥1,719 million a year earlier, and financing outflows ¥671 million against ¥578 million. Cash and cash equivalents ended the year at ¥10,412 million against ¥7,733 million — an increase of ¥2,679 million, and more than a third of total assets.
The company's own first forecast for FY6/2027 has profit down 36% to 38%
Guidance for the year to June 2027 is revenue of ¥28,400 million (−2.9%), operating profit of ¥2,500 million (−36.0%), ordinary profit of ¥2,550 million (−37.8%) and profit attributable to owners of ¥1,800 million (−38.5%), for earnings per share of ¥320.53. The filing states the reason rather than leaving it to be inferred: feed-grain prices are easing but other production costs including personnel keep rising, and chicken market prices have recently softened, so the company expects a tougher business environment. Both of the things that produced the record year are named as already moving against it.
The dividend was raised only modestly. FY6/2026 pays ¥120.00 per share, all at the year-end, against ¥112.50 for FY6/2025; the interim dividend has been ¥0.00 in every year shown. Total dividends paid rise to ¥673 million from ¥631 million, and because profit grew faster than the payment the payout ratio fell from 36.7% to 23.0% while the dividend on equity stayed at 3.0%. FY6/2027 is guided at ¥120.00, held flat — a payout of about 37% against the guided ¥320.53 of earnings per share. The annual general meeting is set for September 25, 2026 and payment starts on September 28, 2026.
| Metric | FY6/2026 | FY6/2025 | Change |
|---|---|---|---|
| Revenue (¥ million) | 29,244 | 26,426 | +10.7% |
| Gross profit (¥ million) | 8,901 | 6,663 | +33.6% |
| Gross margin | 30.4% | 25.2% | +5.2 pt |
| SG&A expenses (¥ million) | 4,996 | 4,542 | +10.0% |
| Operating profit (¥ million) | 3,905 | 2,121 | +84.1% |
| Operating margin | 13.4% | 8.0% | +5.4 pt |
| Ordinary profit (¥ million) | 4,098 | 2,171 | +88.7% |
| Pre-tax profit (¥ million) | 4,093 | 2,534 | +61.5% |
| Net profit attrib. to owners of parent (¥ million) | 2,925 | 1,720 | +70.0% |
| Comprehensive income (¥ million) | 3,115 | 1,431 | +117.6% |
| EPS (¥) | 520.91 | 306.43 | +70.0% |
| Food — revenue (¥ million) | 24,674 | 22,187 | +11.2% |
| Food — segment profit (¥ million) | 3,332 | 1,503 | +121.7% |
| Restaurants — revenue (¥ million) | 4,112 | 3,762 | +9.3% |
| Restaurants — segment profit (¥ million) | 230 | 265 | −13.1% |
| Energy — revenue (¥ million) | 457 | 476 | −4.0% |
| Energy — segment profit (¥ million) | 341 | 352 | −2.9% |
| Total assets (¥ million) | 28,461 | 25,075 | +13.5% |
| Net assets (¥ million) | 24,084 | 21,601 | +11.5% |
| Equity ratio | 84.6% | 86.1% | −1.5 pt |
| FY6/2027 guidance — revenue (¥ million) | 28,400 | — | −2.9% |
| FY6/2027 guidance — operating profit (¥ million) | 2,500 | — | −36.0% |
| FY6/2027 guidance — ordinary profit (¥ million) | 2,550 | — | −37.8% |
| FY6/2027 guidance — net profit (¥ million) | 1,800 | — | −38.5% |
| FY6/2027 guidance — EPS (¥) | 320.53 | — | −38.5% |
| Annual dividend per share (¥) | 120.00 | 120.00 | unchanged |
JapanStockPulse provides informational content only and does not constitute investment advice. Figures are taken from the company's published earnings short report and may be subject to subsequent revision.