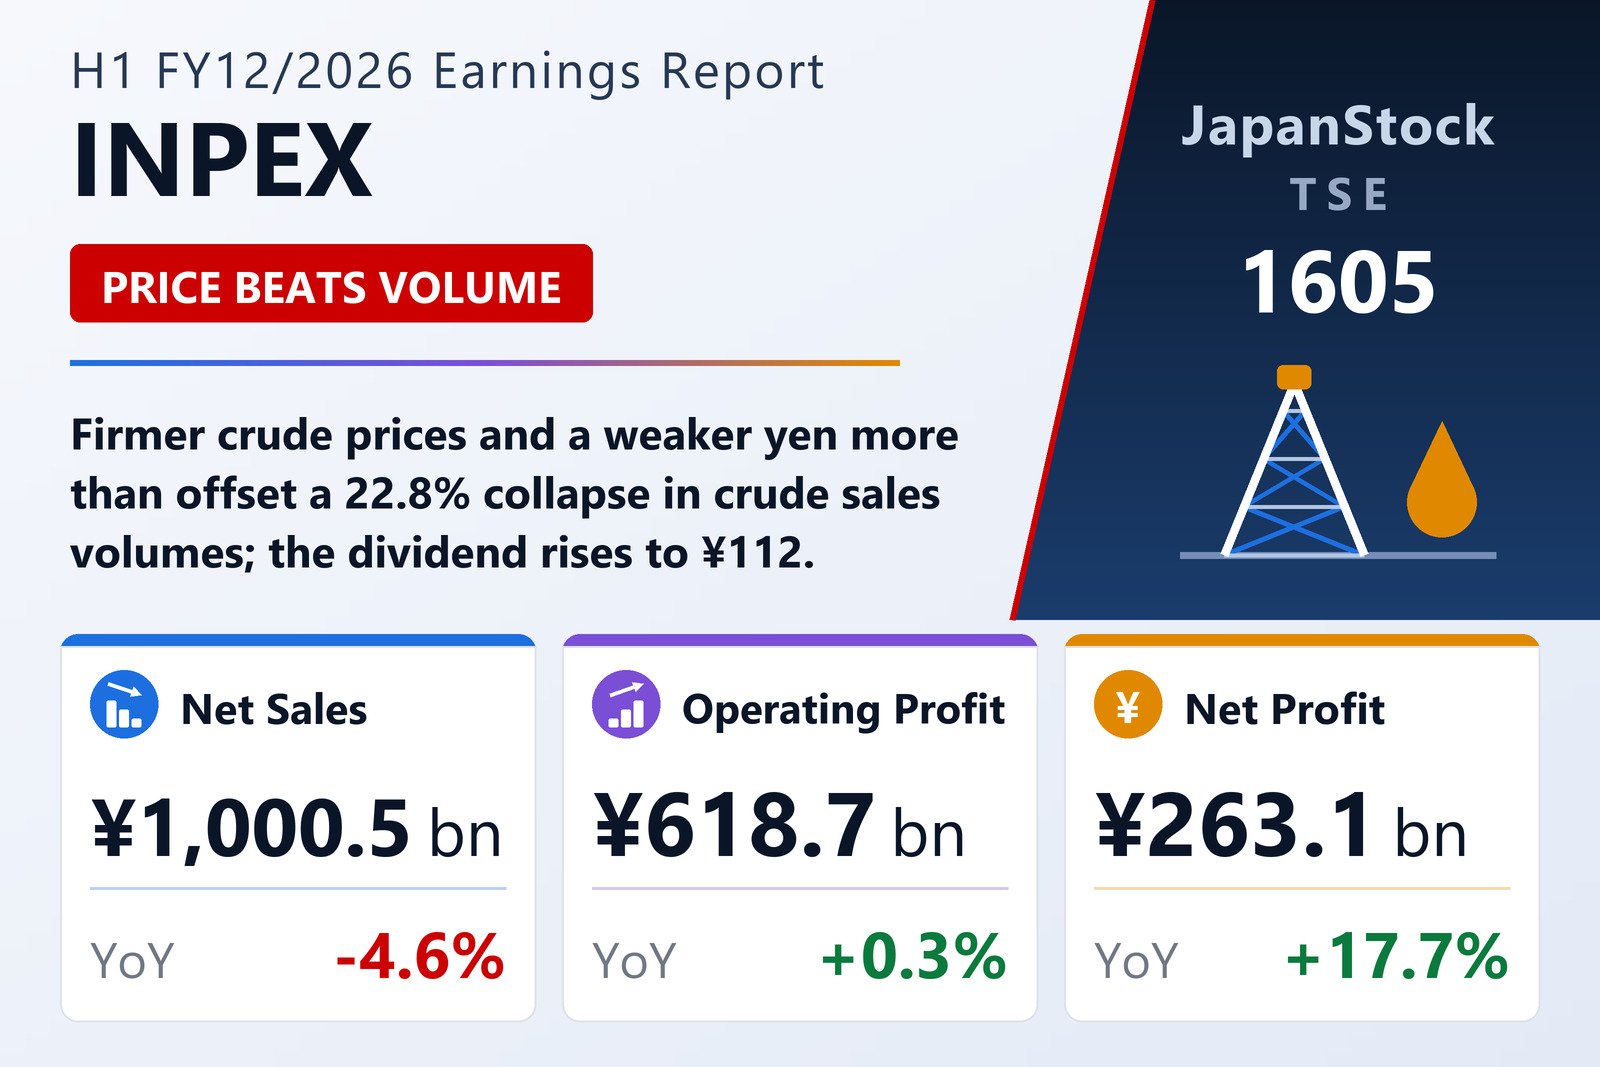
INPEX CORPORATION (TSE: 1605), Japan's largest exploration and production company, reported consolidated results for the six months ended June 30, 2026 under IFRS. Net sales fell 4.6% to ¥1,000,495 million, while operating profit edged up 0.3% to ¥618,713 million and profit before tax was essentially flat at ¥644,346 million, down 0.1%. Interim profit rose 17.4% to ¥284,558 million and profit attributable to owners of the parent climbed 17.7% to ¥263,147 million, lifting basic earnings per share to ¥226.33 from ¥186.65. Total comprehensive income swung to a positive ¥459,759 million from a negative ¥180,570 million a year earlier, on large translation and cash-flow-hedge gains.
Volumes down, prices and the yen up
The revenue decline was almost entirely a volume story. Crude oil sales volume dropped 22.8% to 55.17 million barrels — 16.33 million barrels fewer than a year ago — pulling crude revenue down 10.9% to ¥694.9 billion. Natural gas sales volume edged up 1.2% to 256,808 million cubic feet, lifting gas revenue 8.2% to ¥271.9 billion. Within that, overseas gas slipped 0.6% to 208,903 million cubic feet while domestic gas rose 9.7% to 1,284 million cubic metres (47,905 million cubic feet).
Realised prices moved the other way. The average overseas crude price was $79.51 per barrel, up $6.00 or 8.2% year on year, and the average overseas gas price rose 4.2% to $5.24 per thousand cubic feet; domestic gas fell 5.0% to ¥77.00 per cubic metre. The average sales exchange rate weakened 6.7% to ¥158.37 to the dollar. Management's own bridge attributes the ¥48.3 billion revenue decline to a ¥169.5 billion volume drag, offset by ¥49.2 billion from higher unit prices, ¥55.6 billion from the weaker yen and ¥16.2 billion of other revenue.
Below the top line, cost of sales fell 0.9% to ¥427.5 billion and exploration expenses dropped 14.9% to ¥5.1 billion, while SG&A rose 8.3% to ¥62.5 billion. Other operating income surged nearly ninefold to ¥45.6 billion and equity-method investment income rose 15.1% to ¥74.9 billion, which together carried operating profit to a marginal gain. A 10.7% drop in income tax expense, to ¥359.8 billion, is what converted a flat pre-tax result into a double-digit rise in bottom-line profit.
Ichthys carries the segment mix
The flagship Ichthys LNG project in Australia was the standout. Segment revenue rose 17.5% to ¥215,840 million on higher realised crude prices and segment profit jumped 24.5% to ¥173,071 million. Other overseas projects saw revenue fall 12.0% to ¥659,200 million on lower crude volumes, yet profit still rose 7.8% to ¥77,879 million thanks to lower tax charges. Domestic oil and gas lifted revenue 6.4% to ¥112,663 million on stronger gas sales, but higher cost of sales cut segment profit 54.4% to ¥7,881 million. The "Other" segment — renewables and power, plus CCS and hydrogen — turned a ¥5,331 million loss into a ¥2,436 million profit on revenue of ¥12,791 million.
Group production totalled 113,930 thousand barrels of oil equivalent, or 629 thousand boe per day, against 121,769 thousand boe (673 thousand boe/d) a year earlier. Crude output was 65,568 thousand barrels (362 thousand b/d) and natural gas 254,988 million cubic feet (1,409 million cf/d). Ichthys alone produced 44,475 thousand boe (246 thousand boe/d), including 197,716 million cubic feet of gas.
Balance sheet and cash flow
Total assets grew ¥651.7 billion from the end of FY12/2025 to ¥8,386,904 million, with current assets up ¥330.3 billion to ¥1,439,473 million and non-current assets up ¥321.3 billion to ¥6,947,431 million on higher oil and gas assets. Total liabilities rose ¥323.6 billion to ¥3,035,951 million. Total equity increased ¥328.0 billion to ¥5,350,952 million, of which equity attributable to owners of the parent rose ¥355.4 billion to ¥5,102,570 million; the parent equity ratio was 60.8%, down slightly from 61.4% as the asset base expanded faster.
Operating cash flow rose ¥125.9 billion to ¥553,888 million, helped by lower income tax payments. Investing outflows widened ¥60.4 billion to ¥424,704 million on heavier development and production spending, and financing outflows widened ¥50.8 billion to ¥91,024 million. Cash and equivalents ended the half at ¥216,190 million, up from ¥168,407 million at the start of the year.
Guidance raised, dividend lifted, buyback continues
INPEX revised its full-year FY12/2026 forecast the same day, replacing wide ranges with point estimates. It now guides net sales of ¥1,973,000 million (−1.9%), operating profit of ¥1,223,000 million (+7.7%), profit before tax of ¥1,278,000 million (+8.9%) and profit attributable to owners of ¥510,000 million (+29.5%), for basic EPS of ¥438.82. Against the previous range of ¥350,000–450,000 million for net profit, that is an upgrade of ¥60,000–160,000 million, or 13.3% to 45.7%. Management cited solid production at Ichthys and revised assumptions for crude prices and the yen from the third quarter onward, while noting that uncertainty over the Middle East remains.
The updated assumptions put the first-half Brent average at an actual $87.6 per barrel, with $80.0 assumed for the third quarter and $70.0 for the fourth — a second-half average of $75.0 and a full-year average of $81.4. The exchange-rate assumption is ¥158.3 actual for the first half, ¥160.0 for the second half and ¥159.2 for the full year.
Shareholder returns were stepped up alongside the upgrade. The interim dividend was raised to ¥56.00 per share from ¥50.00, with a matching ¥56.00 year-end forecast for an annual total of ¥112.00, up from ¥100.00 in FY12/2025; payment of the interim dividend begins on September 1, 2026. The unlisted Class A shares carry a corresponding increase, to ¥22,400.00 per half and ¥44,800.00 for the year. Buybacks also continued: treasury shares rose to 96,916,062 from 93,742,368, reflecting ¥9,975 million of purchases in the half, and the weighted average share count fell to 1,162,656,732 from 1,197,572,337 — a mechanical tailwind to per-share earnings.
| Metric | H1 FY12/2026 | H1 FY12/2025 | YoY |
|---|---|---|---|
| Net sales (¥ billion) | 1,000.50 | 1,048.87 | -4.6% |
| Operating profit (¥ billion) | 618.71 | 616.88 | +0.3% |
| Profit before tax (¥ billion) | 644.35 | 644.98 | -0.1% |
| Profit attrib. to owners (¥ billion) | 263.15 | 223.53 | +17.7% |
| Basic EPS (¥) | 226.33 | 186.65 | +21.3% |
| Interim dividend (¥) | 56.00 | 50.00 | +12.0% |
| Crude sales volume (million bbl) | 55.17 | 71.50 | -22.8% |
| Avg. overseas crude price (US$/bbl) | 79.51 | 73.51 | +8.2% |
| Total assets (¥ billion, vs FY25 end) | 8,386.90 | 7,735.20 | +8.4% |
| FY12/2026 net profit guidance (¥ billion) | 510.00 | 393.82 | +29.5% |
JapanStockPulse provides informational content only and does not constitute investment advice. Figures are taken from the company's published earnings short report and may be subject to subsequent revision.