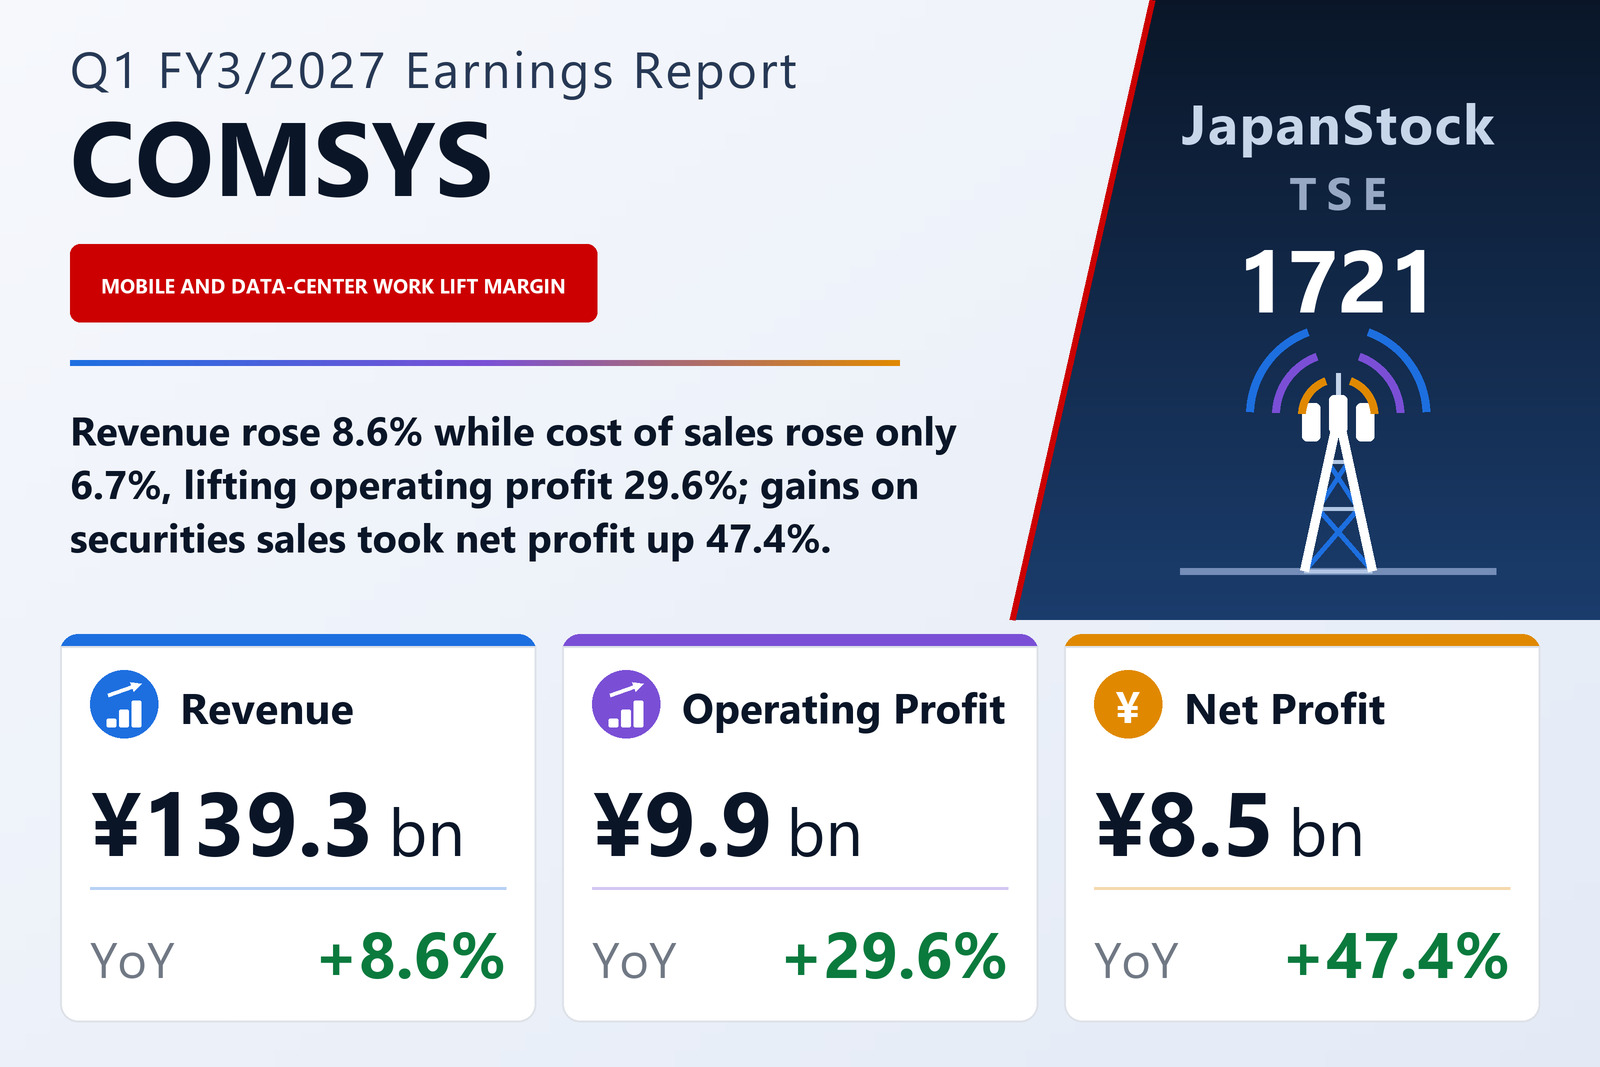
A wider gross margin turned 8.6% sales growth into 29.6% profit growth
COMSYS Holdings Corporation (TSE: 1721), the holding company of a group of construction companies whose work spans telecom-carrier networks, IT solutions and social-infrastructure systems, published consolidated results for the first quarter of the fiscal year ending March 2027 — the three months from April 1 to June 30, 2026 — on August 7, 2026 under Japanese GAAP. Revenue rose 8.6% to ¥139,329 million, operating profit 29.6% to ¥9,905 million, ordinary profit 27.5% to ¥10,587 million and profit attributable to owners of the parent 47.4% to ¥8,538 million, for earnings of ¥73.89 per share against ¥49.32. Orders received rose 13.2% to ¥194,116 million. The shares are listed on the Tokyo Stock Exchange.
The margin arithmetic explains most of the operating result. Cost of sales rose 6.7% to ¥118,319 million, about two percentage points slower than revenue, so gross profit rose 21.2% to ¥21,010 million and the gross margin widened from 13.5% to 15.1%. Selling, general and administrative expenses grew faster than revenue, by 14.5% to ¥11,104 million, lifting their share of revenue from 7.6% to 8.0% and absorbing ¥1,409 million of the ¥3,675 million gain in gross profit. Operating profit still rose by ¥2,265 million, and the operating margin moved from 6.0% to 7.1%. The filing does not break down the rise in SG&A; it does record four companies newly brought into consolidation in the quarter, and amortization of goodwill rose to ¥125 million from ¥34 million.
Securities sales, not trading, explain why net profit outran operating profit
Non-operating items moved little. Non-operating income was ¥772 million against ¥783 million, most of it ¥550 million of dividends received, and non-operating expenses fell to ¥90 million from ¥121 million, so ordinary profit rose 27.5%, close to the operating line. The gap opened below it. Extraordinary income was ¥2,718 million against ¥530 million, of which ¥2,510 million was gains on sales of investment securities, against ¥513 million a year earlier. Extraordinary losses were ¥269 million against ¥15 million, including a ¥103 million provision for loss on damage compensation. Profit before income taxes therefore rose 47.9% to ¥13,036 million. After income taxes of ¥4,328 million and ¥169 million attributable to non-controlling interests, profit attributable to owners of the parent was ¥8,538 million. The filing itself attributes the net-profit increase to sales of investment securities and similar items, and investment securities on the balance sheet fell to ¥34,339 million from ¥41,577 million.
Earnings per share rose faster than net profit, 49.8% against 47.4%, because the average number of shares outstanding fell to 115,556,960 from 117,474,446. Comprehensive income rose only 17.6% to ¥7,578 million, because other comprehensive income was a negative ¥1,129 million, led by an ¥810 million decline in valuation differences on available-for-sale securities, against a positive ¥527 million a year earlier.
Mobile network work for NTT and data-center construction carried the quarter
The group reports eight segments by operating-company group, and discloses revenue across three businesses. Telecom Carrier revenue rose 6.4% to ¥61,923 million from ¥58,179 million: the filing says communication-quality improvement work (mobile) on NTT facilities stayed strong, as it was in the previous fiscal year, while facilities work for NCC carriers was weak on lower capital spending. Social Systems grew fastest, by 17.7% to ¥49,505 million from ¥42,065 million, on smooth progress in large data-center construction projects and on the addition of newly consolidated subsidiaries; that figure includes ¥450 million from businesses outside the reportable segments. IT Solutions was essentially flat at ¥27,900 million against ¥28,024 million, down 0.4%, as other projects made up for the absence of a large project booked a year earlier.
Orders followed the same pattern, although the filing gives no figures by business. It says Telecom Carrier orders rose on the NTT mobile work despite weak NCC demand, IT Solutions orders fell against the prior year's large project, and Social Systems orders rose on a large data-center project won and on the orders of subsidiaries consolidated from April. Total orders of ¥194,116 million, up ¥22,708 million, exceeded the quarter's revenue by ¥54,787 million.
On profit, the filing credits Telecom Carrier's higher revenue and the strong mobile quality work, says IT Solutions covered the prior-year project with other work, and attributes the Social Systems increase to higher revenue and to productivity initiatives. By operating group, the largest segment, Nippon COMSYS Group, lifted segment profit 35.3% to ¥5,385 million on revenue of ¥72,017 million, up 10.5%. TOSYS Group's profit rose to ¥504 million from ¥35 million and NDS Group's to ¥1,588 million from ¥1,376 million, while TSUUKEN Group's fell to ¥870 million from ¥1,151 million and SANWA COMSYS Engineering Group's loss widened to ¥52 million from ¥33 million. Profit across the eight reportable segments totalled ¥9,892 million against ¥7,504 million.
Receivables fell, cash rose, and ¥3,548 million went on buybacks
Total assets fell 2.5% to ¥551,582 million from ¥565,709 million at March 31, 2026, which the filing attributes mainly to lower notes and accounts receivable on completed construction contracts, down to ¥151,145 million from ¥209,870 million. Cash and deposits rose to ¥71,262 million from ¥42,033 million, and costs on construction in progress to ¥54,318 million from ¥45,580 million. Liabilities fell ¥10,571 million to ¥147,686 million, mainly on lower notes and accounts payable for construction, while advances received on construction in progress rose to ¥21,034 million from ¥11,564 million. Net assets fell ¥3,555 million to ¥403,896 million, which the filing puts down chiefly to dividends paid from retained earnings, and the equity ratio rose from 70.7% to 71.8% because total assets shrank faster than equity. Goodwill rose to ¥1,210 million from ¥96 million: ¥244 million from three companies consolidated in the TOSYS Group segment and ¥994 million from one in the SYSKEN Group segment.
Treasury stock rose ¥3,266 million to ¥9,977 million. Under a board resolution of May 12, 2026, the company acquired 655 thousand of its own shares between May 13 and June 30, 2026, for ¥3,548 million. Issued shares were unchanged at 118,000,000, and treasury shares — which include those held by an ESOP stock-grant trust — rose to 2,859,056 from 2,297,943. No quarterly cash-flow statement was prepared; depreciation was ¥2,783 million against ¥2,617 million.
Guidance and dividend plan unchanged
COMSYS Holdings left its full-year FY3/2027 guidance unchanged from the figures announced on May 12, 2026: revenue of ¥670,000 million (+6.2%), operating profit of ¥54,000 million (+6.1%), ordinary profit of ¥55,000 million (+5.4%) and profit attributable to owners of the parent of ¥37,860 million (+4.3%), for earnings per share of ¥327.22. The first quarter delivered 20.8% of guided revenue, 18.3% of guided operating profit, 19.2% of guided ordinary profit and 22.6% of guided net profit, the last figure lifted by the securities gains. The filing does not comment on how the year is expected to phase.
The dividend forecast is also unchanged: ¥65.00 at the interim and ¥70.00 at the year-end, for an annual ¥135.00 against ¥130.00 for FY3/2026 (¥60.00 interim and ¥70.00 year-end), up 3.8% and equivalent to about 41% of guided earnings per share. The quarterly financial statements have not been reviewed by the auditor; the company plans to disclose a version with the review report attached on August 14, 2026. The filing also notes that the group was named to the CDP A List for supplier engagement on climate change and was included in the SOMPO Sustainability Index for a second consecutive year.
| Metric | Q1 FY3/2027 | Q1 FY3/2026 | Change |
|---|---|---|---|
| Orders received (¥ million) | 194,116 | 171,408 | +13.2% |
| Revenue (¥ million) | 139,329 | 128,268 | +8.6% |
| Gross profit (¥ million) | 21,010 | 17,335 | +21.2% |
| Gross margin | 15.1% | 13.5% | +1.6 pt |
| SG&A expenses (¥ million) | 11,104 | 9,695 | +14.5% |
| Operating profit (¥ million) | 9,905 | 7,639 | +29.6% |
| Operating margin | 7.1% | 6.0% | +1.1 pt |
| Ordinary profit (¥ million) | 10,587 | 8,301 | +27.5% |
| Net profit attrib. to owners of parent (¥ million) | 8,538 | 5,793 | +47.4% |
| EPS (¥) | 73.89 | 49.32 | +49.8% |
| Telecom Carrier Business — revenue (¥ million) | 61,923 | 58,179 | +6.4% |
| IT Solutions Business — revenue (¥ million) | 27,900 | 28,024 | −0.4% |
| Social Systems Business — revenue (¥ million) | 49,505 | 42,065 | +17.7% |
| Nippon COMSYS Group — revenue (¥ million) | 72,017 | 65,178 | +10.5% |
| Nippon COMSYS Group — segment profit (¥ million) | 5,385 | 3,981 | +35.3% |
| Total assets (¥ million) | 551,582 | 565,709 | −2.5% |
| Net assets (¥ million) | 403,896 | 407,451 | −0.9% |
| Equity ratio | 71.8% | 70.7% | +1.1 pt |
| FY3/2027 guidance — revenue (¥ million) | 670,000 | — | +6.2% |
| FY3/2027 guidance — operating profit (¥ million) | 54,000 | — | +6.1% |
| FY3/2027 guidance — ordinary profit (¥ million) | 55,000 | — | +5.4% |
| FY3/2027 guidance — net profit (¥ million) | 37,860 | — | +4.3% |
| FY3/2027 guidance — EPS (¥) | 327.22 | — | — |
| Annual dividend per share (¥) | 135.00 | 130.00 | +3.8% |
JapanStockPulse provides informational content only and does not constitute investment advice. Figures are taken from the company's published earnings short report and may be subject to subsequent revision.