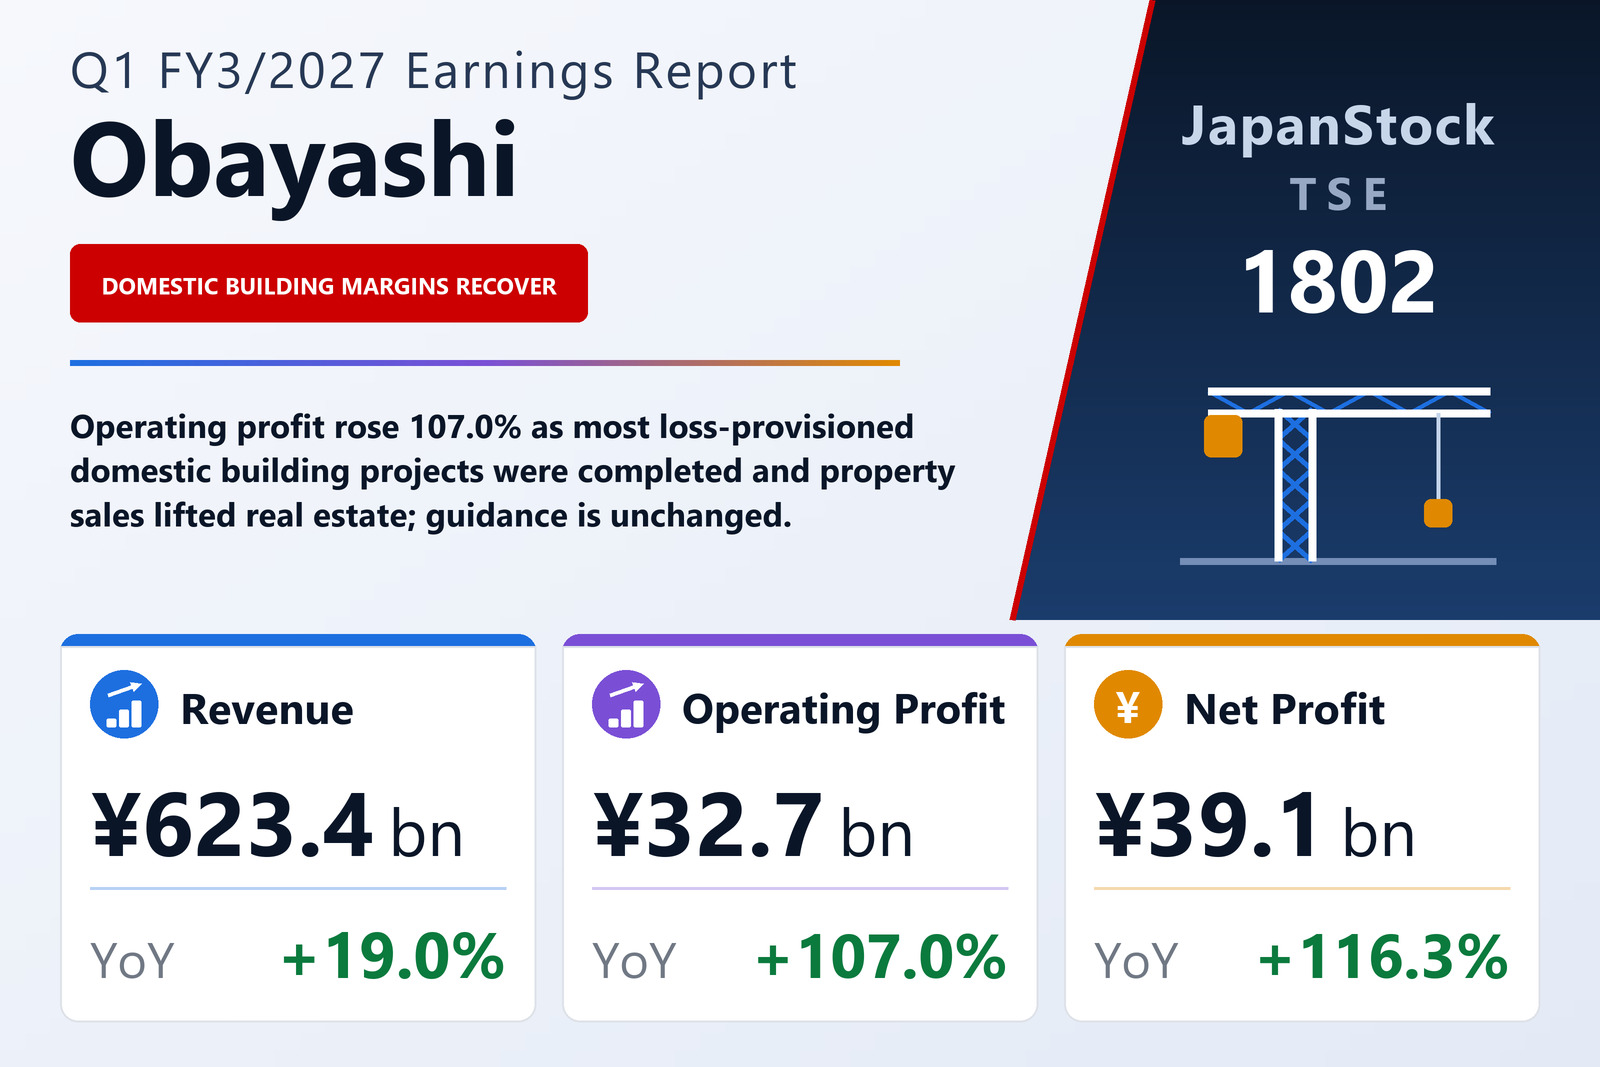
Revenue up 19.0%, operating profit up 107.0%
Obayashi Corporation (TSE: 1802), the general contractor whose business spans building construction and civil engineering in Japan and overseas as well as real estate, published consolidated results for the first quarter of the fiscal year ending March 2027 — the three months from April 1 to June 30, 2026 — on August 7, 2026, under Japanese GAAP. Revenue rose 19.0% to ¥623,429 million, operating profit 107.0% to ¥32,700 million, ordinary profit 98.2% to ¥36,468 million and profit attributable to owners of the parent 116.3% to ¥39,091 million. Earnings per share were ¥56.87 against ¥25.59.
The filing attributes the revenue gain to steady progress on an ample backlog of work in domestic building, domestic civil engineering and overseas civil engineering; to the consolidation of GCON, a company acquired in December 2025 and reported in overseas building; and to sales of properties in the real estate business. Completed construction contracts rose 16.3% to ¥577,492 million and real estate and other revenue 67.8% to ¥45,937 million. Margins moved further than volume. The gross margin on completed construction widened from 9.8% to 11.1% and the real estate gross margin from 21.0% to 28.9%, so total gross profit rose 42.8% to ¥77,538 million and the overall gross margin went from 10.4% to 12.4%. Selling, general and administrative expenses grew more slowly than revenue, rising 16.4% to ¥44,838 million. They absorbed ¥6,323 million of the ¥23,225 million increase in gross profit, and the operating margin rose from 3.0% to 5.2%.
Domestic building and real estate supplied almost all of the increase
The segment figures here are sales to external customers and the operating profit attributable to them — the basis of the filing's supplementary tables, on which the segments add up to the group totals. Domestic Building, the largest segment, grew revenue 16.3% to ¥264,387 million, and its operating profit rose 165.0% to ¥13,254 million, lifting its margin from 2.2% to 5.0%. The filing says most of the domestic building projects for which provisions for construction losses had been recorded were broadly completed, and that profitable projects made a larger contribution. Real Estate revenue nearly tripled, up 191.8% to ¥30,488 million, and its operating profit rose 562.1% to ¥9,538 million on sales of properties. Together the two segments added ¥16,351 million of operating profit, against a group increase of ¥16,902 million.
The other segments were mixed. Overseas Building revenue rose 13.7% to ¥130,608 million, a period that included GCON, but its operating profit fell 54.1% to ¥1,328 million, a margin of 1.0% against 2.5%; the filing gives no reason for the decline. Group amortization of goodwill rose to ¥813 million from ¥424 million, which the filing does not allocate by segment. Domestic Civil Engineering grew revenue 13.9% to ¥102,904 million and operating profit 53.7% to ¥4,738 million, and Overseas Civil Engineering grew revenue 24.5% to ¥79,592 million and operating profit 55.2% to ¥3,532 million. Other businesses, which include PFI projects, renewable energy and financial services, saw revenue fall 8.7% to ¥15,449 million and operating profit 72.1% to ¥307 million.
Below the operating line, share sales added ¥20,064 million
Non-operating income rose to ¥5,401 million from ¥4,232 million while non-operating expenses were flat at ¥1,632 million, so ordinary profit exceeded operating profit by ¥3,768 million and rose 98.2% to ¥36,468 million. Extraordinary income was ¥20,110 million against ¥8,938 million, almost all of it gains on sales of investment securities of ¥20,064 million, up from ¥8,585 million; the filing cites higher gains on sales of strategic shareholdings as a factor in the net result. Pre-tax profit rose 106.4% to ¥56,277 million. Income taxes of ¥16,135 million equalled 28.7% of pre-tax profit, against 31.9% a year earlier, and profit attributable to non-controlling interests was ¥1,050 million against ¥507 million. Earnings per share rose 122.2%, faster than net profit, because the average number of shares outstanding fell to 687,420,953 from 706,249,614.
Comprehensive income rose to ¥18,708 million from ¥4,637 million but was less than half of quarterly profit of ¥40,142 million, because other comprehensive income was a loss of ¥21,433 million. Its largest component was a ¥23,799 million fall in the valuation difference on available-for-sale securities, in a quarter in which, the filing says, investment securities also declined through sales of strategic shareholdings.
Group orders fell 7.2%; parent-company orders rose 54.2%
Consolidated orders, which the filing reports only in hundreds of millions of yen, were ¥577.5 billion, down 7.2% from ¥622.0 billion. The decline came in overseas building, where orders fell to ¥39.0 billion from ¥234.5 billion, while domestic building orders rose 75.1% to ¥306.8 billion. At the parent company, orders received rose 54.2% to ¥358,545 million, and domestic public-sector building orders were ¥132,897 million against ¥1,901 million a year earlier. The parent's order backlog stood at ¥2,912,356 million at June 30, 2026, 7.5% higher than a year earlier and little changed from ¥2,910,999 million at March 31, 2026.
On a non-consolidated basis, revenue rose 17.5% to ¥357,188 million and operating profit 108.2% to ¥15,066 million, but ordinary profit fell 4.0% to ¥37,702 million as interest and dividend income declined to ¥22,396 million from ¥32,269 million. Non-consolidated net profit rose 11.4% to ¥46,631 million.
The balance sheet shrank as receivables and securities holdings declined
Total assets fell 2.6% to ¥3,063,036 million from ¥3,143,449 million at March 31, 2026. Cash and deposits rose to ¥457,543 million from ¥430,885 million, but notes and accounts receivable from completed construction contracts fell to ¥976,366 million from ¥1,083,224 million, and investment securities fell to ¥301,692 million from ¥339,322 million, which the filing attributes in part to sales of strategic shareholdings. Total liabilities fell 3.5% to ¥1,763,294 million, mainly on lower construction payables, and interest-bearing debt was ¥342.8 billion against ¥344.0 billion. Net assets fell 1.3% to ¥1,299,742 million: retained earnings rose, but the valuation difference on securities fell to ¥123,936 million from ¥147,730 million. With liabilities falling faster than equity, the equity ratio rose from 40.0% to 40.6%. The company did not prepare a quarterly cash-flow statement; depreciation was ¥9,285 million against ¥8,550 million.
Full-year guidance still points to lower profit
Obayashi left its FY3/2027 guidance unchanged from the figures announced on May 13, 2026: revenue of ¥2,945,000 million (+13.9%), operating profit of ¥180,000 million (−7.5%), ordinary profit of ¥183,000 million (−10.4%) and profit attributable to owners of the parent of ¥157,000 million (−9.6%), or ¥228.39 per share. The first quarter delivered 21.2% of guided revenue, 18.2% of guided operating profit and 24.9% of guided net profit. Reaching the operating-profit forecast requires ¥147,300 million over the remaining nine months, against ¥178,880 million in the same nine months of FY3/2026, when full-year operating profit was ¥194,678 million. The filing's segment forecast places the decline in domestic building, whose operating profit is expected to fall 21.2% to ¥82,000 million from ¥104,088 million — more than the group's entire expected decline. This document gives no reason for that forecast.
The dividend forecast was also unchanged: ¥47.00 at the second quarter and ¥47.00 at the year-end, for an annual ¥94.00 against ¥88.00 for FY3/2026, up 6.8%. That equals about 41% of guided earnings per share.
| Metric | Q1 FY3/2027 | Q1 FY3/2026 | Change |
|---|---|---|---|
| Revenue (¥ million) | 623,429 | 523,763 | +19.0% |
| Revenue — completed construction contracts (¥ million) | 577,492 | 496,392 | +16.3% |
| Revenue — real estate business and other (¥ million) | 45,937 | 27,370 | +67.8% |
| Gross profit (¥ million) | 77,538 | 54,313 | +42.8% |
| Gross margin | 12.4% | 10.4% | +2.1 pt |
| Gross margin — completed construction | 11.1% | 9.8% | +1.3 pt |
| SG&A expenses (¥ million) | 44,838 | 38,515 | +16.4% |
| Operating profit (¥ million) | 32,700 | 15,798 | +107.0% |
| Operating margin | 5.2% | 3.0% | +2.2 pt |
| Ordinary profit (¥ million) | 36,468 | 18,396 | +98.2% |
| Pre-tax profit (¥ million) | 56,277 | 27,271 | +106.4% |
| Net profit attrib. to owners of parent (¥ million) | 39,091 | 18,070 | +116.3% |
| Comprehensive income (¥ million) | 18,708 | 4,637 | +303.5% |
| EPS (¥) | 56.87 | 25.59 | +122.2% |
| Domestic Building — revenue (¥ million) | 264,387 | 227,294 | +16.3% |
| Domestic Building — segment profit (¥ million) | 13,254 | 5,001 | +165.0% |
| Overseas Building — revenue (¥ million) | 130,608 | 114,835 | +13.7% |
| Overseas Building — segment profit (¥ million) | 1,328 | 2,896 | −54.1% |
| Domestic Civil Engineering — revenue (¥ million) | 102,904 | 90,317 | +13.9% |
| Domestic Civil Engineering — segment profit (¥ million) | 4,738 | 3,081 | +53.7% |
| Overseas Civil Engineering — revenue (¥ million) | 79,592 | 63,945 | +24.5% |
| Overseas Civil Engineering — segment profit (¥ million) | 3,532 | 2,276 | +55.2% |
| Real Estate — revenue (¥ million) | 30,488 | 10,448 | +191.8% |
| Real Estate — segment profit (¥ million) | 9,538 | 1,440 | +562.1% |
| Other — revenue (¥ million) | 15,449 | 16,922 | −8.7% |
| Other — segment profit (¥ million) | 307 | 1,102 | −72.1% |
| Orders received — parent company (¥ million) | 358,545 | 232,497 | +54.2% |
| Total assets (¥ million) | 3,063,036 | 3,143,449 | −2.6% |
| Net assets (¥ million) | 1,299,742 | 1,316,466 | −1.3% |
| Equity ratio | 40.6% | 40.0% | +0.6 pt |
| FY3/2027 guidance — revenue (¥ million) | 2,945,000 | — | +13.9% |
| FY3/2027 guidance — operating profit (¥ million) | 180,000 | — | −7.5% |
| FY3/2027 guidance — ordinary profit (¥ million) | 183,000 | — | −10.4% |
| FY3/2027 guidance — net profit (¥ million) | 157,000 | — | −9.6% |
| FY3/2027 guidance — EPS (¥) | 228.39 | — | — |
| Annual dividend per share (¥) | 94.00 | 88.00 | +6.8% |
JapanStockPulse provides informational content only and does not constitute investment advice. Figures are taken from the company's published earnings short report and may be subject to subsequent revision.