A general contractor that lost money on construction
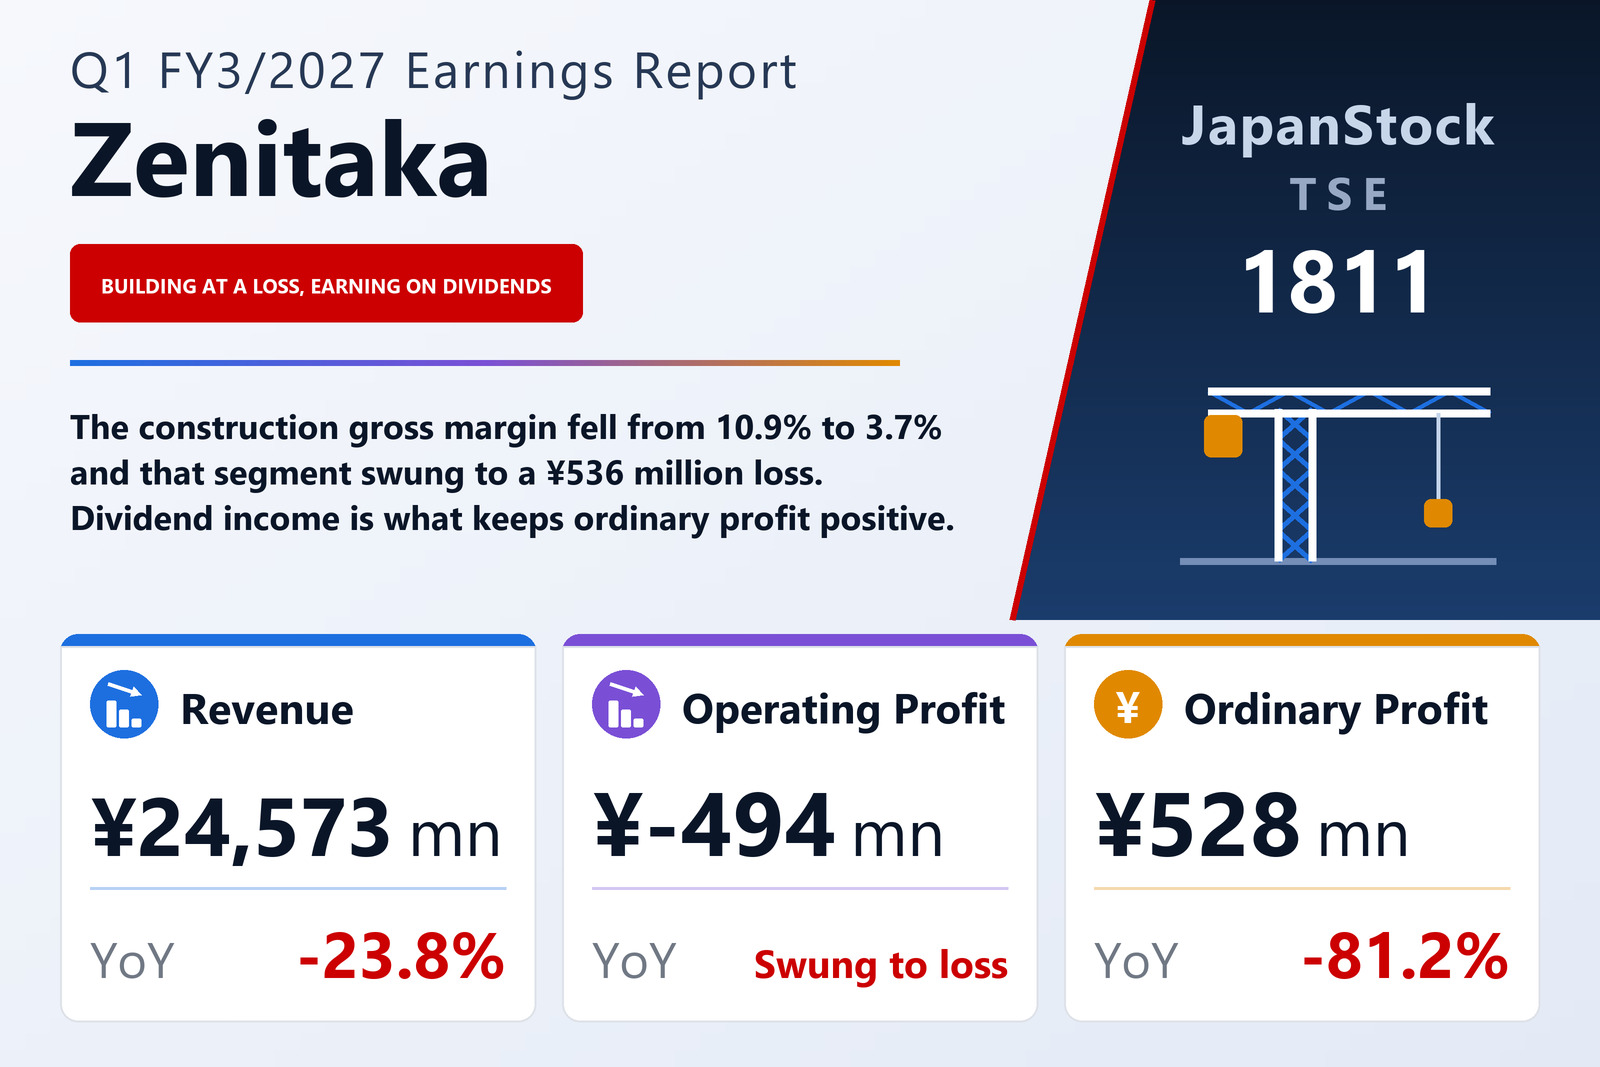
THE ZENITAKA CORPORATION (TSE: 1811), the Osaka-headquartered general contractor listed on the Tokyo Stock Exchange Standard market and the Nagoya Stock Exchange Main market, published consolidated results for the three months to June 30, 2026 on August 7, 2026 under Japanese GAAP. Revenue fell 23.8% to ¥24,573 million and the group swung to an operating loss of ¥494 million from a profit of ¥2,103 million. Ordinary profit survived at ¥528 million, down 81.2%, pre-tax profit fell 88.5% to ¥306 million, and profit attributable to owners of the parent came to ¥55 million, down 96.9% — earnings per share of ¥7.78 against ¥248.72.
The mechanical cause sits in one line. Completed construction revenue fell 24.4% to ¥23,900 million, but construction gross profit fell far faster, to ¥889 million from ¥3,432 million, because the construction cost of sales came down only to ¥23,010 million from ¥28,177 million. That is a construction gross margin of 3.7%, against 10.9% a year earlier. Group gross profit therefore fell 65.5% to ¥1,333 million on revenue down 23.8%, while selling, general and administrative expenses rose 3.9% to ¥1,828 million. Revenue down a quarter, gross profit down two-thirds and overheads up produces an operating loss arithmetically.
Construction lost ¥536 million; real estate, at under 3% of revenue, earned ¥415 million
The segment note says the same thing without netting. Construction revenue of ¥23,900 million (−24.4%) produced a segment loss of ¥536 million, against a profit of ¥1,962 million a year earlier — a swing of ¥2,498 million. Real Estate, the smaller segment at ¥673 million of revenue (+3.1%), earned a segment profit of ¥415 million against ¥404 million, its cost of sales barely moving at ¥229 million against ¥223 million. The adjustment line, mainly the parent's head-office administrative costs, was −¥373 million against −¥264 million. Real estate is under 3% of group revenue and earned more than seven times the group's entire reported profit.
The reported profit does not come from building anything
Ordinary profit is positive only because of what sits below the operating line. Non-operating income was ¥1,138 million against ¥887 million, its largest item dividends received of roughly ¥1,094 million, while non-operating expenses fell to ¥114 million from ¥185 million. That is what turns a ¥494 million operating loss into ¥528 million of ordinary profit. Stated plainly: the quarter's reported profit is investment income, not construction income.
Extraordinary losses then took ¥222 million — a ¥209 million loss on valuation of investment securities and a ¥13 million loss on retirement of fixed assets — against ¥146 million a year earlier, when there was also a ¥10 million gain on the sale of investment securities. Pre-tax profit was ¥306 million, income taxes ¥250 million (down 71.9%), and ¥55 million reached the bottom line. The contrast with comprehensive income is worth stating: it rose 11.0% to ¥3,722 million from ¥3,352 million. Unrealised gains on the same kind of securities holdings are running through other comprehensive income while a valuation loss on part of that portfolio ran through the profit and loss account.
Orders fell 27.8%, and public building work all but disappeared
The order book is the forward indicator and it offers no relief. Group orders received fell 27.8% to ¥19,957 million, with private-sector orders down 29.1% to ¥19,146 million. Building construction orders fell 29.2% to ¥17,925 million: private-sector building orders were ¥17,923 million (−29.1%), and public-sector building orders came to ¥1 million, down 95.1%. Civil engineering orders fell 12.7% to ¥2,032 million, with private-sector civil orders down 29.2% to ¥1,222 million. The one line that grew was public-sector civil engineering, up 34.6% to ¥809 million, which lifted total public-sector orders 27.2% to ¥810 million — about 4% of the group total.
The balance sheet strengthened while the income statement did not
Total assets rose 0.6% to ¥218,780 million from ¥217,459 million at March 31, 2026, and net assets rose 2.5% to ¥118,108 million from ¥115,244 million. The equity ratio rose to 54.0% from 53.0%, and net assets per share to ¥16,492.03 from ¥16,092.19. Equity grew by far more than the quarter earned, which is the balance-sheet echo of the comprehensive income line: ¥3,722 million of comprehensive income against ¥55 million of net profit is valuation gains on securities, not retained trading profit.
Guidance unchanged; the year-end dividend is undetermined
Full-year FY3/2027 guidance is unchanged: revenue of ¥112,600 million (−10.3%), operating profit of ¥1,300 million (−72.4%), ordinary profit of ¥2,520 million (−60.7%) and profit attributable to owners of ¥1,510 million (−64.5%), for earnings per share of ¥210.85. The company was already guiding to a sharply worse year before this quarter, and it left that forecast in place after opening the year with an operating loss. The arithmetic that leaves is demanding: the quarter's ¥24,573 million of revenue is 21.8% of the annual guide, and the guided ¥1,300 million of operating profit now requires ¥1,794 million of operating profit over the remaining nine months.
The dividend is left open. For FY3/2026 the company paid ¥120.00 per share, all of it at the year-end — there was no interim dividend. For FY3/2027 the year-end dividend is stated as undetermined, and the filing says so explicitly rather than guiding a figure; there has been no revision to a previously announced dividend forecast. Against guided earnings per share of ¥210.85, the filing carries no dividend figure at all for the year now in progress.
| Metric | Q1 FY3/2027 | Q1 FY3/2026 | Change |
|---|---|---|---|
| Revenue (¥ million) | 24,573 | 32,263 | −23.8% |
| Gross profit (¥ million) | 1,333 | 3,862 | −65.5% |
| SG&A expenses (¥ million) | 1,828 | 1,759 | +3.9% |
| Operating profit (¥ million) | −494 | 2,103 | profit to loss |
| Ordinary profit (¥ million) | 528 | 2,806 | −81.2% |
| Pre-tax profit (¥ million) | 306 | 2,670 | −88.5% |
| Net profit attrib. to owners of parent (¥ million) | 55 | 1,781 | −96.9% |
| Comprehensive income (¥ million) | 3,722 | 3,352 | +11.0% |
| EPS (¥) | 7.78 | 248.72 | −96.9% |
| Construction — revenue (¥ million) | 23,900 | 31,609 | −24.4% |
| Construction — segment profit (¥ million) | −536 | 1,962 | profit to loss |
| Real Estate — revenue (¥ million) | 673 | 653 | +3.1% |
| Real Estate — segment profit (¥ million) | 415 | 404 | +2.7% |
| Orders received (¥ million) | 19,957 | — | −27.8% |
| Total assets (¥ million) | 218,780 | 217,459 | +0.6% |
| Net assets (¥ million) | 118,108 | 115,244 | +2.5% |
| Equity ratio | 54.0% | 53.0% | +1.0 pt |
| FY3/2027 guidance — revenue (¥ million) | 112,600 | — | −10.3% |
| FY3/2027 guidance — operating profit (¥ million) | 1,300 | — | −72.4% |
| FY3/2027 guidance — ordinary profit (¥ million) | 2,520 | — | −60.7% |
| FY3/2027 guidance — net profit (¥ million) | 1,510 | — | −64.5% |
| Annual dividend per share (¥) | — | 120.00 | n.m. |
JapanStockPulse provides informational content only and does not constitute investment advice. Figures are taken from the company's published earnings short report and may be subject to subsequent revision.