One acquisition explains the whole half
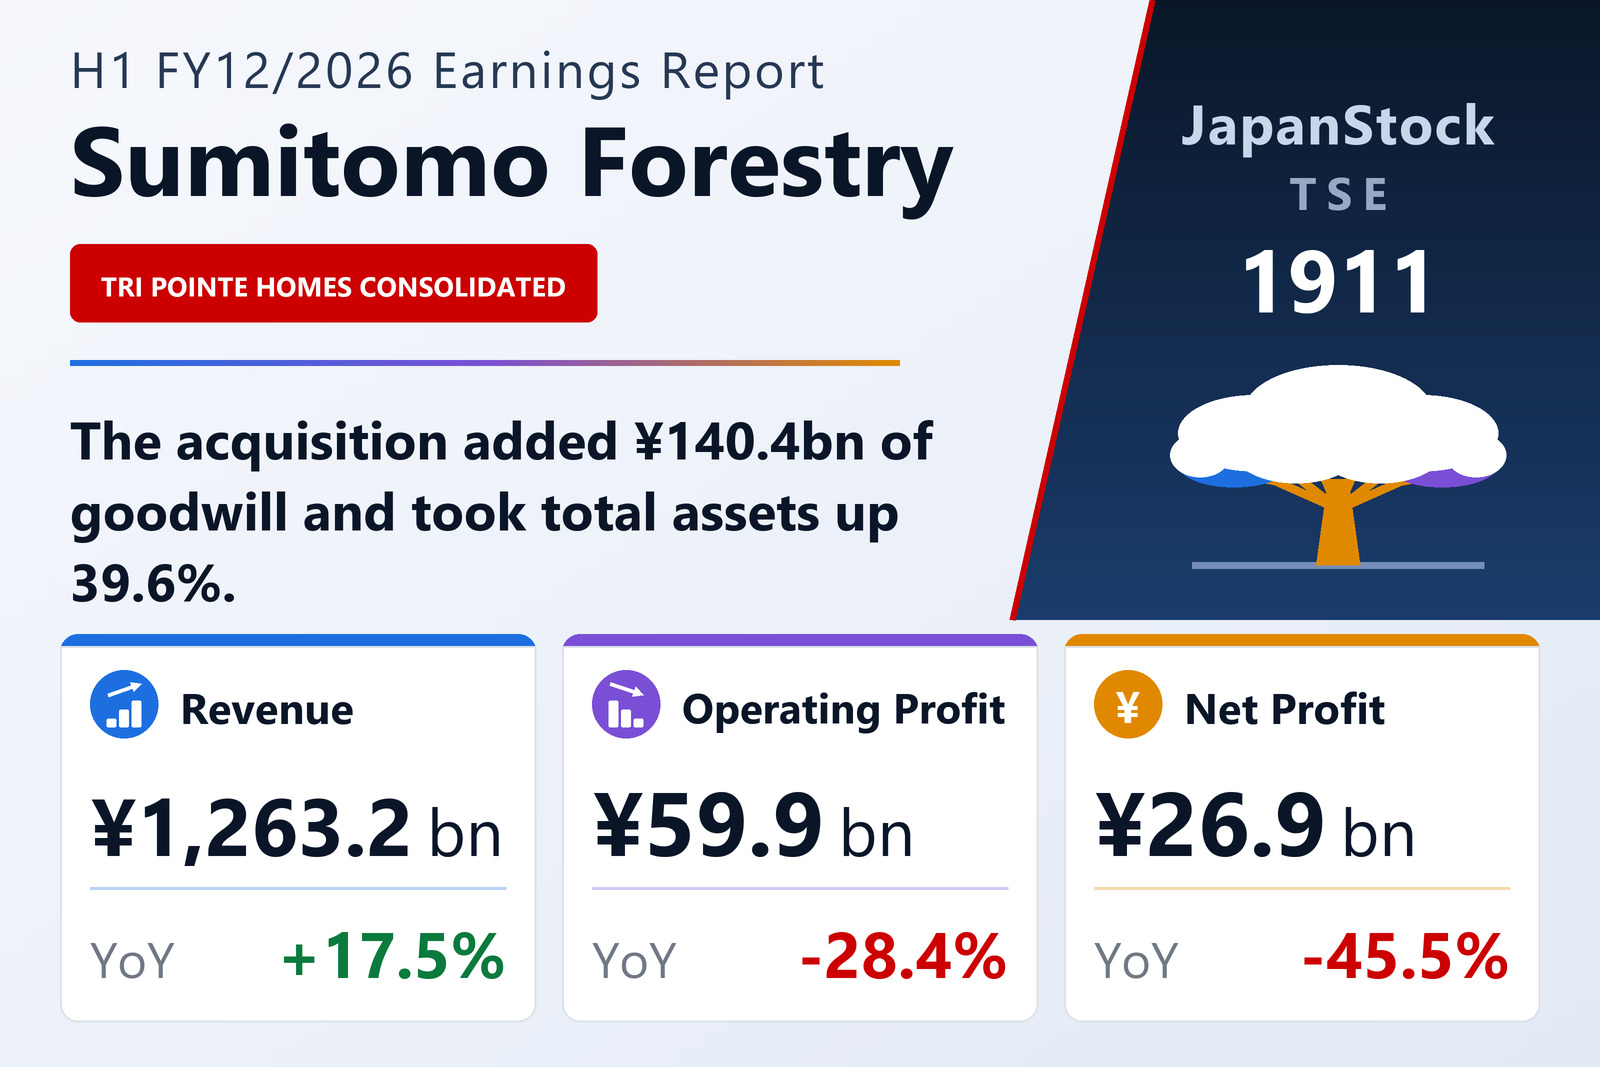
Sumitomo Forestry Co., Ltd. (TSE: 1911) published consolidated results for the six months to June 30, 2026 on August 7, 2026 under Japanese GAAP. Net sales rose 17.5% to ¥1,263,248 million, but operating profit fell 28.4% to ¥59,921 million, ordinary profit 43.6% to ¥49,769 million and net profit attributable to owners of the parent 45.5% to ¥26,885 million, for earnings per share of ¥43.85 against ¥80.38. The operating margin narrowed to 4.7% from 7.8%.
During the half the group brought the Tri Pointe Homes group — Tri Pointe Homes, Inc. and 40 other companies — into consolidation in its overseas housing business. Goodwill rose by ¥140,425 million as a result, a figure the company states is provisional because the purchase-price allocation was not complete at the period end.
What that did to the balance sheet
Total assets rose 39.6% from the December year-end to ¥3,590,048 million — an increase of just over ¥1 trillion in six months — while net assets rose only 9.2% to ¥1,240,832 million. The equity ratio consequently fell to 30.5% from 39.0%, an 8.5-point drop. Comprehensive income was ¥127,877 million against a loss of ¥10,263 million a year earlier, far above the ¥26,885 million that reached the bottom line.
The company also disclosed a subsequent event: on August 7, 2026 the board resolved a comprehensive framework to issue up to ¥300 billion of subordinated bonds — undated to 40 years, with deferrable coupons and early-redemption clauses — through July 9, 2027, for investment, capital expenditure, subsidiary funding, debt repayment, bond redemption, working capital and commercial-paper redemption. Read alongside the equity ratio, that is a hybrid-capital response to a balance sheet that has just grown by a trillion yen.
Overseas Housing: revenue up 26.5%, profit down 38.6%
The group reorganised its segments in January 2026, splitting the former Construction & Real Estate business so that reporting now runs across five segments rather than four; prior-year figures are restated on the new basis.
Overseas Housing — 57% of group sales — lifted revenue 26.5% to ¥722,533 million but its segment profit fell 38.6% to ¥45,701 million. That combination is what an acquisition into a soft market looks like: the acquired revenue arrives in full while the margin on it does not. Housing in Japan grew revenue 6.1% to ¥276,687 million on profit down 6.4%, and Timber & Building Materials was flat on revenue at ¥112,121 million with profit down 79.3% to ¥616 million.
The two loss-making segments both widened. Real Estate grew revenue 17.0% to ¥130,482 million but its loss went to ¥12,926 million from ¥6,310 million, and Resources & Environment to ¥1,214 million from ¥763 million. Segment profit here is measured on an ordinary-profit basis.
Guidance cut on profit, raised on revenue
Full-year FY12/2026 guidance was revised, and it moves in two directions at once: net sales of ¥2,950,000 million (+30.1%) against operating profit of ¥143,000 million (−15.2%), ordinary profit of ¥115,000 million (−34.2%) and net profit of ¥60,000 million (−43.7%), for earnings per share of ¥97.85. A company forecasting 30% revenue growth and a 44% profit decline in the same breath is describing an acquisition, not a trading collapse.
The annual dividend forecast rises to ¥53.00 per share from ¥50.00, split ¥25.00 interim and ¥28.00 year-end. Per-share figures throughout are on a post-split basis, following the three-for-one stock split effective July 1, 2025.
| Metric | H1 FY12/2026 | H1 FY12/2025 | Change |
|---|---|---|---|
| Net sales (¥ million) | 1,263,248 | 1,074,750 | +17.5% |
| Operating profit (¥ million) | 59,921 | 83,718 | −28.4% |
| Operating margin | 4.7% | 7.8% | −3.1 pt |
| Ordinary profit (¥ million) | 49,769 | 88,221 | −43.6% |
| Net profit attrib. to owners of parent (¥ million) | 26,885 | 49,320 | −45.5% |
| Comprehensive income (¥ million) | 127,877 | −10,263 | loss to profit |
| EPS (¥) | 43.85 | 80.38 | −45.4% |
| Timber & Building Materials — revenue (¥ million) | 112,121 | 111,454 | +0.6% |
| Timber & Building Materials — segment profit (¥ million) | 616 | 2,983 | −79.3% |
| Housing — revenue (¥ million) | 276,687 | 260,855 | +6.1% |
| Housing — segment profit (¥ million) | 16,872 | 18,019 | −6.4% |
| Overseas Housing — revenue (¥ million) | 722,533 | 571,016 | +26.5% |
| Overseas Housing — segment profit (¥ million) | 45,701 | 74,471 | −38.6% |
| Real Estate — revenue (¥ million) | 130,482 | 111,483 | +17.0% |
| Real Estate — segment profit (¥ million) | −12,926 | −6,310 | loss widened |
| Resources & Environment — revenue (¥ million) | 12,711 | 11,717 | +8.5% |
| Resources & Environment — segment profit (¥ million) | −1,214 | −763 | loss widened |
| Total assets (¥ million) | 3,590,048 | 2,572,032 | +39.6% |
| Net assets (¥ million) | 1,240,832 | 1,136,786 | +9.2% |
| Equity ratio | 30.5% | 39.0% | −8.5 pt |
| FY12/2026 guidance — revenue (¥ million) | 2,950,000 | — | +30.1% |
| FY12/2026 guidance — operating profit (¥ million) | 143,000 | — | −15.2% |
| FY12/2026 guidance — ordinary profit (¥ million) | 115,000 | — | −34.2% |
| FY12/2026 guidance — net profit (¥ million) | 60,000 | — | −43.7% |
| FY12/2026 guidance — EPS (¥) | 97.85 | — | n.m. |
| Annual dividend per share (¥) | 53.00 | 50.00 | +6.0% |
JapanStockPulse provides informational content only and does not constitute investment advice. Figures are taken from the company's published earnings short report and may be subject to subsequent revision.