Less work, better work
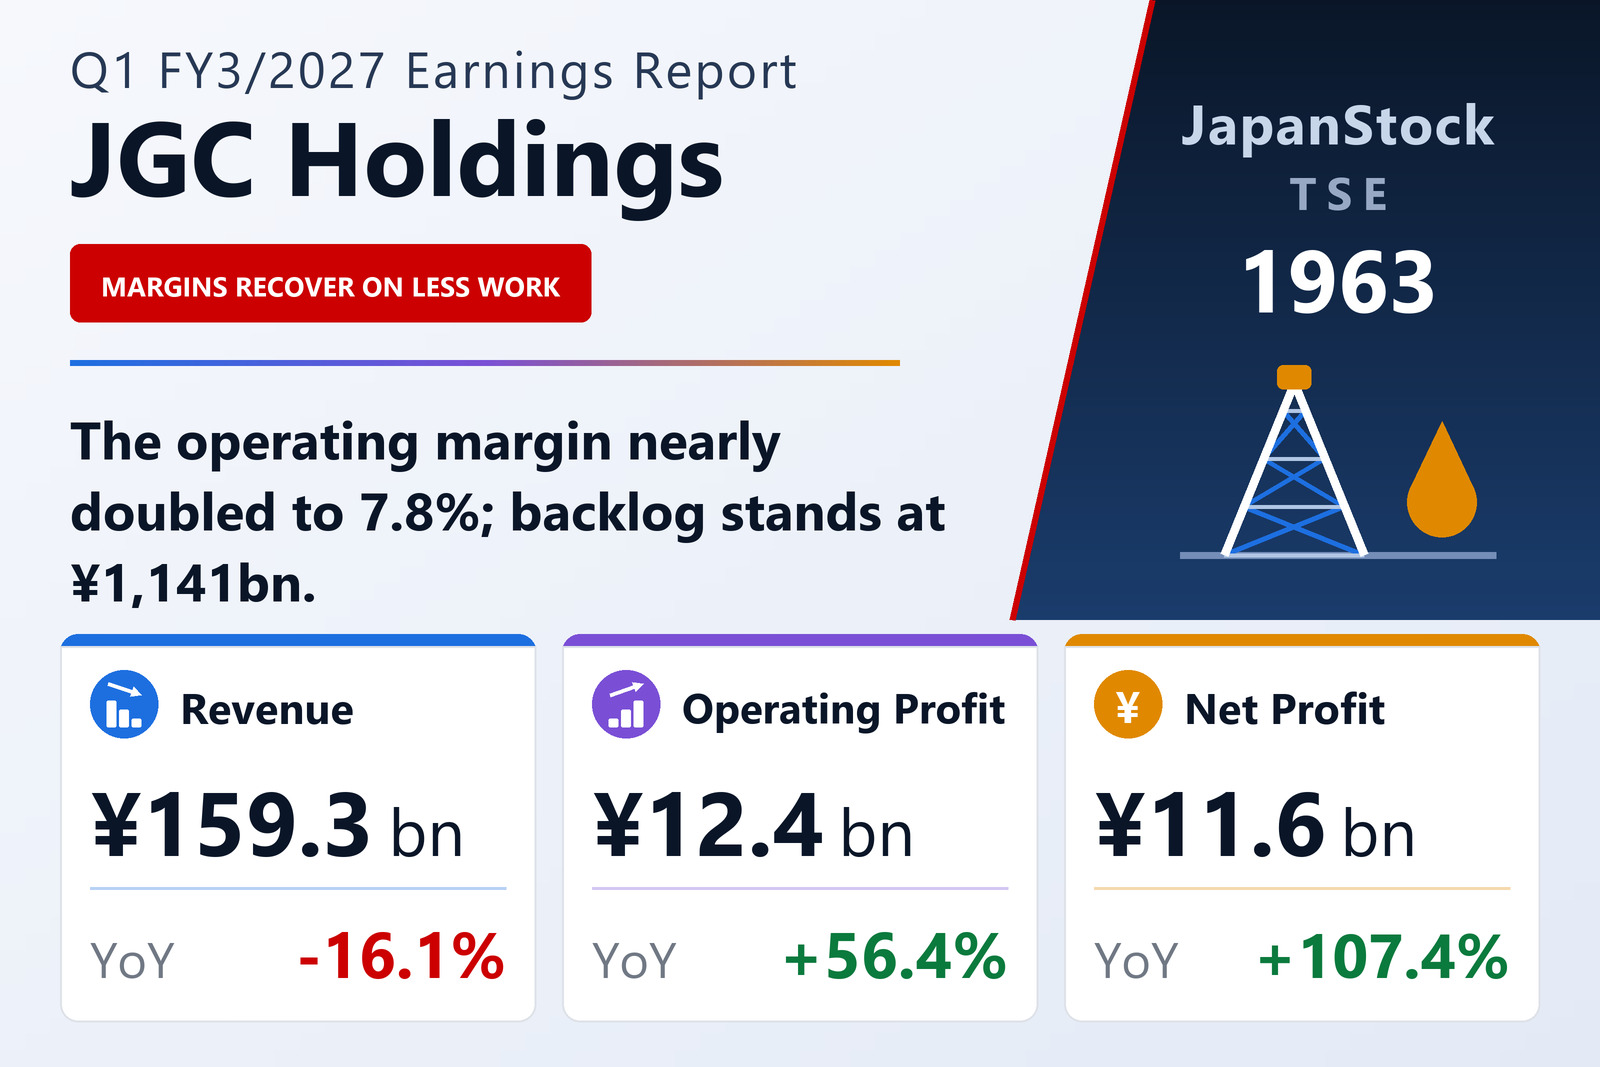
JGC Holdings Corporation (TSE: 1963) published consolidated results for the three months to June 30, 2026 on August 7, 2026 under Japanese GAAP. Net sales fell 16.1% to ¥159,299 million, but operating profit rose 56.4% to ¥12,355 million, ordinary profit 132.3% to ¥21,378 million and net profit attributable to owners of the parent 107.4% to ¥11,617 million, for earnings per share of ¥48.03 against ¥23.17.
The operating margin widened to 7.8% from 4.2%. For an EPC contractor, revenue is a function of how much work happens to be in execution in a given quarter; the margin is a function of how those contracts were priced and how they are running. On that reading a 16% revenue decline alongside a 56% profit rise is the better of the two combinations.
The gap between operating and ordinary profit is wide and widened further: ¥9,023 million this quarter against ¥1,302 million a year earlier. Comprehensive income was ¥8,462 million against a loss of ¥1,272 million, and sits below net profit — the reverse of the usual pattern, which points to negative other comprehensive income, most plausibly currency translation.
Both segments improved
Total Engineering — 90% of group revenue — saw sales fall 18.1% to ¥142,656 million while segment profit rose 55.4% to ¥11,578 million. Functional Materials Manufacturing, the catalysts and fine-chemicals business, grew on both lines: revenue up 6.9% to ¥15,591 million and profit up 29.4% to ¥2,382 million.
That second segment is small — under a tenth of revenue — but it earned a 15.3% margin against Total Engineering's 8.1%, and it is the part of the group whose earnings do not depend on the timing of large projects.
The order book: the number that decides next year
For a contractor the backlog matters more than the quarter. Total Engineering took ¥114,508 million of new orders against ¥142,656 million of revenue recognised, so the segment consumed backlog faster than it replaced it: the closing balance eased to ¥1,141,226 million from ¥1,155,589 million, a book-to-bill of 0.80.
Within the domestic order book the largest single line is healthcare and life sciences at ¥80,403 million of backlog, ahead of oil and gas (¥15,763 million), chemicals (¥16,155 million) and clean energy (¥23,115 million). Domestic backlog totals ¥141,123 million, which implies roughly ¥1.0 trillion overseas. JGC Emirates L.L.C-FZ was newly consolidated during the quarter.
Balance sheet and guidance
Total assets rose 1.3% from the March year-end to ¥850,037 million while net assets fell 1.0% to ¥427,059 million, easing the equity ratio to 50.0% from 51.2%.
Guidance for FY3/2027 is unchanged: net sales of ¥670,000 million (−10.1%), operating profit of ¥40,000 million (+13.0%), ordinary profit of ¥46,000 million (−20.9%) and net profit of ¥46,000 million (+9.9%), for earnings per share of ¥190.25. Ordinary and net profit are guided at the same figure, which implies the company expects tax, extraordinary items and minority interests to net out across the year — unusual, and worth watching. The quarter delivered 30.9% of the full-year operating-profit target in three of twelve months. The annual dividend forecast is unchanged at ¥52.00 per share, paid entirely at the year-end.
| Metric | Q1 FY3/2027 | Q1 FY3/2026 | Change |
|---|---|---|---|
| Net sales (¥ million) | 159,299 | 189,821 | −16.1% |
| Operating profit (¥ million) | 12,355 | 7,899 | +56.4% |
| Operating margin | 7.8% | 4.2% | +3.6 pt |
| Ordinary profit (¥ million) | 21,378 | 9,201 | +132.3% |
| Net profit attrib. to owners of parent (¥ million) | 11,617 | 5,600 | +107.4% |
| Comprehensive income (¥ million) | 8,462 | −1,272 | loss to profit |
| EPS (¥) | 48.03 | 23.17 | +107.3% |
| Total Engineering — revenue (¥ million) | 142,656 | 174,129 | −18.1% |
| Total Engineering — segment profit (¥ million) | 11,578 | 7,452 | +55.4% |
| Functional Materials Manufacturing — revenue (¥ million) | 15,591 | 14,588 | +6.9% |
| Functional Materials Manufacturing — segment profit (¥ million) | 2,382 | 1,841 | +29.4% |
| Orders received (¥ million) | 114,508 | — | n.m. |
| Order backlog (¥ million) | 1,141,226 | 1,155,589 | −1.2% |
| Total assets (¥ million) | 850,037 | 838,793 | +1.3% |
| Net assets (¥ million) | 427,059 | 431,191 | −1.0% |
| Equity ratio | 50.0% | 51.2% | −1.2 pt |
| FY3/2027 guidance — revenue (¥ million) | 670,000 | — | −10.1% |
| FY3/2027 guidance — operating profit (¥ million) | 40,000 | — | +13.0% |
| FY3/2027 guidance — ordinary profit (¥ million) | 46,000 | — | −20.9% |
| FY3/2027 guidance — net profit (¥ million) | 46,000 | — | +9.9% |
| FY3/2027 guidance — EPS (¥) | 190.25 | — | n.m. |
| Annual dividend per share (¥) | 52.00 | 52.00 | unchanged |
JapanStockPulse provides informational content only and does not constitute investment advice. Figures are taken from the company's published earnings short report and may be subject to subsequent revision.