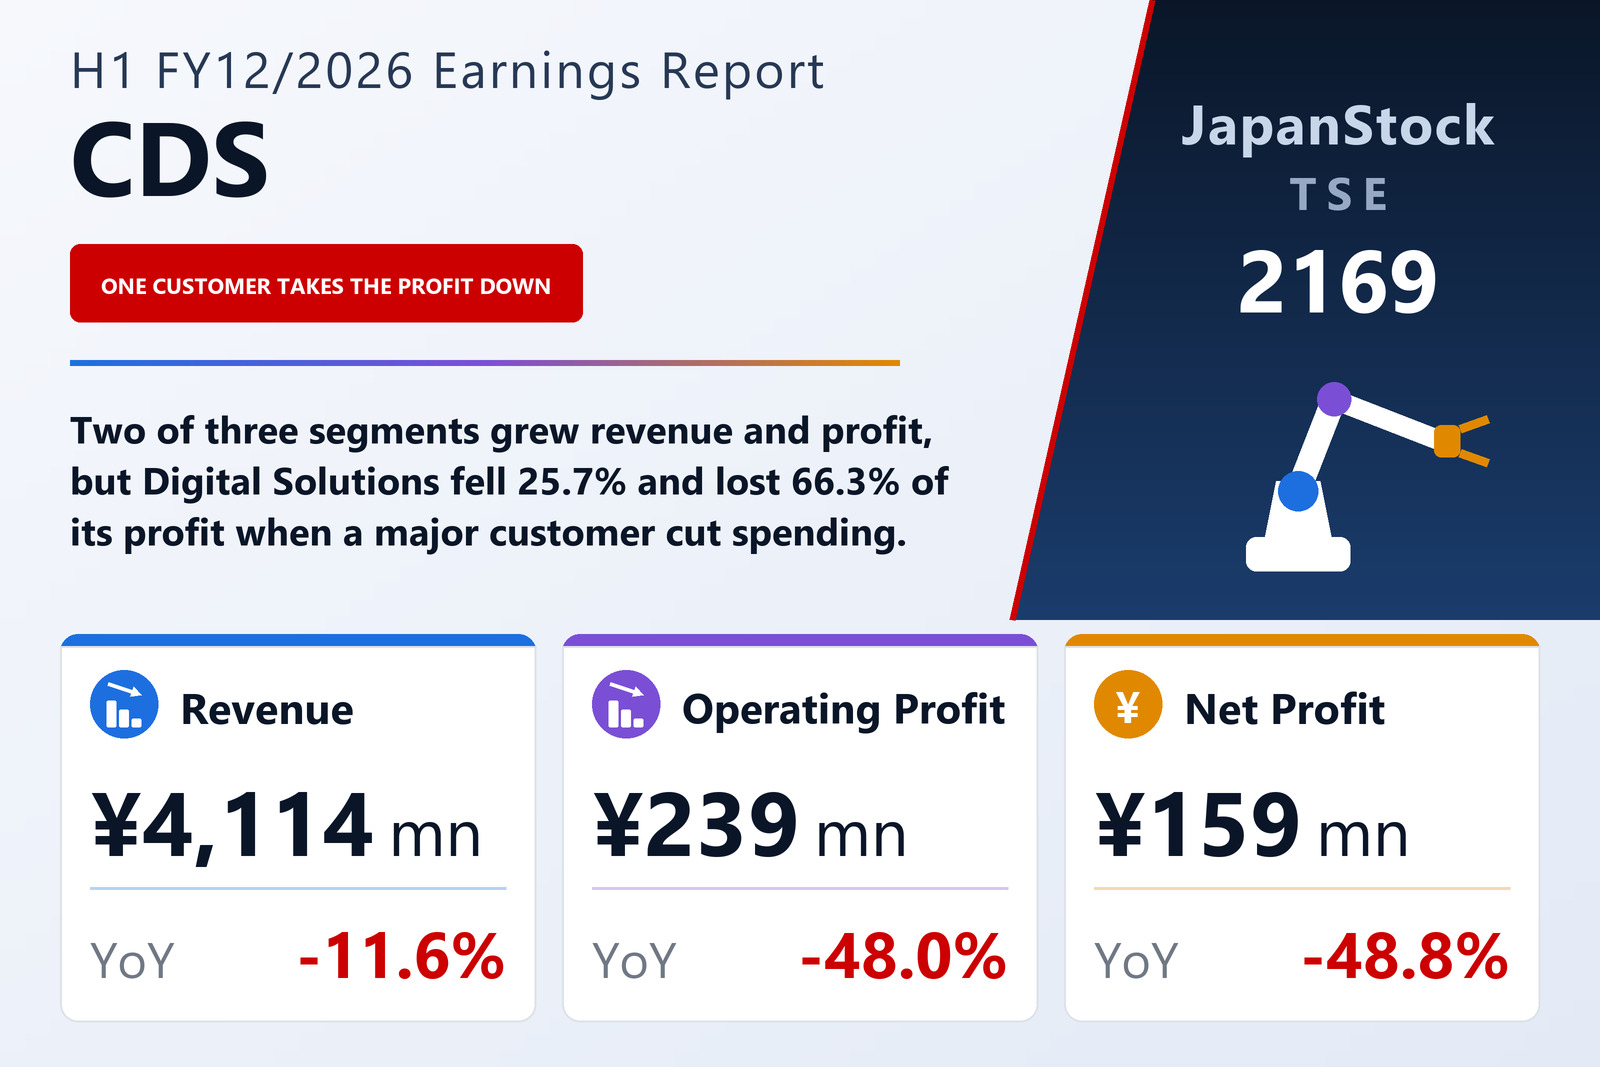
Two of three segments grew, and the group still lost almost half its operating profit
CDS Co., Ltd. (TSE: 2169), the Nagoya-based group whose engineering and information services run into the automotive, industrial-equipment, medical-device, information-equipment and education sectors, published consolidated results for the six months to June 30, 2026 on August 7, 2026 under Japanese GAAP. Revenue fell 11.6% to ¥4,114 million, gross profit 14.1% to ¥1,189 million, operating profit 48.0% to ¥239 million, ordinary profit 46.2% to ¥251 million and profit attributable to owners of the parent 48.8% to ¥159 million, or ¥23.38 per share against ¥45.67. Comprehensive income was ¥231 million against ¥327 million, and the operating margin fell from 9.9% to 5.8%.
The mechanism sits between those two lines. Gross profit fell ¥195 million, from ¥1,383,798 thousand to ¥1,188,511 thousand, while selling, general and administrative expenses rose ¥26 million, from ¥923,366 thousand to ¥949,016 thousand. Operating profit therefore fell ¥221 million, from ¥460,432 thousand to ¥239,495 thousand. Cost of sales came down 10.5%, slightly less than the 11.6% fall in revenue, and the overhead above it grew: the cost base did not follow the revenue down. Below the operating line, pre-tax interim profit was ¥251 million against ¥467 million and income taxes ¥91 million against ¥156 million, so the 48.8% fall at the net line matches the fall at the operating line.
The largest segment by revenue lost two thirds of its profit when one customer pulled back
Digital Solutions revenue fell 25.7% to ¥1,856 million and its segment profit 66.3% to ¥133 million. The filing gives one cause: a major customer whose own management environment deteriorated restrained investment and cut costs. The other two businesses moved the other way. Technical Information Solutions revenue rose 2.7% to ¥1,762 million and its profit 4.8% to ¥424 million; FA Robot Solutions revenue rose 9.7% to ¥525 million and its profit 60.1% to ¥39 million, on more corporate orders and on cuts to its own selling and administrative expenses. Segment revenue includes inter-segment sales and transfers, as the filing states, and the table follows that basis.
That is the group's half-year in one line. Two of three segments grew both revenue and profit; the group still fell, because the one that shrank is the largest by revenue and it lost two thirds of its profit. The growth in the other two did not offset it. The company describes the three businesses as being run so that they link and complement each other, and on the revenue side that design is visible — but so is the concentration, because the shortfall traces to a single customer's spending decision and the filing names no replacement demand.
A second consecutive first half of falling profit
This is not the first such half. In H1 FY12/2025, as the company discloses, revenue rose 6.8% while operating profit fell 32.8%, ordinary profit 31.5% and net profit 31.4%. The shape differs — last year the group grew its top line and lost profit anyway, this year it lost both — but the profit line has now fallen in two consecutive first halves.
The filing's reading of the environment is cautious. Japan's economy is recovering moderately on better employment and income, it says, but the outlook is unclear: United States tariff policy, the prolonged Russian invasion of Ukraine, the worsening situation in the Middle East after United States and Israeli strikes on Iran, unstable supply and prices for oil and petroleum products, and a continuing weak yen. In the automotive market, where its main customers sit, tariff policy and rising geopolitical risk still require watching. In industrial equipment there has been a pick-up, on increased automation and labour-saving investment.
Assets grew, equity did not, and ¥1,188 million went into time deposits
Total assets rose 3.6% to ¥10,981 million at June 30, 2026, up ¥381 million from December 31, 2025, while net assets fell ¥21 million to ¥8,871 million. Because the balance sheet grew and equity did not, the equity ratio fell from 83.9% to 80.8%. Current assets were ¥7,573 million, up ¥240 million, with cash and deposits up ¥488 million against electronically recorded receivables down ¥175 million. Fixed assets were ¥3,408 million, up ¥140 million, mainly on a ¥182 million rise in investments and other assets, chiefly investment securities. Liabilities rose ¥402 million to ¥2,110 million: current liabilities were ¥2,032 million, up ¥375 million, where other current liabilities — mainly accrued expenses — rose ¥412 million against notes and accounts payable down ¥36 million and short-term borrowings down ¥50 million, and non-current liabilities were ¥78 million.
Investing activities used ¥1,041 million, ¥899 million more than a year earlier, and almost all of that is a movement of cash rather than a commitment: ¥1,188 million was placed in time deposits, ¥1,062 million more than a year earlier. Capital spending itself was small — ¥14 million on tangible fixed assets, ¥76 million less than a year earlier, and ¥26 million on intangible fixed assets, ¥14 million more. Financing used ¥301 million, ¥327 million less than a year earlier: a ¥50 million reduction in short-term borrowings, ¥280 million less than the reduction a year earlier, and ¥251 million of dividends paid, ¥47 million less. Issued shares were unchanged at 6,924,400, treasury shares were 104,822 against 104,761, and the weighted average for the half was 6,819,629 against 6,819,639.
The unchanged forecast needs the second half to earn more than three times the first
Full-year guidance is unchanged from the forecast published on February 13, 2026 with the FY12/2025 results: revenue of ¥9,451 million (+7.1%), operating profit of ¥993 million (+44.9%), ordinary profit of ¥992 million (+42.3%) and profit attributable to owners of ¥663 million (+45.3%), for earnings per share of ¥97.21. Set against the half just reported, the arithmetic is stark. First-half revenue of ¥4,114 million is 43.5% of the revenue guide; first-half operating profit of ¥239 million is 24.1% of the profit guide. To reach ¥993 million the second half must produce ¥754 million — more than three times the first half — after a first half in which operating profit fell 48.0%. The company left the forecast where it was, and this filing gives no revised second-half bridge: it does not explain the step.
The dividend is held flat. An interim dividend of ¥37.00 per share has been declared and a year-end dividend of ¥37.00 is forecast, for ¥74.00 for the year — the same interim, the same year-end and the same total as FY12/2025, with no revision recorded. Extraordinary items were negligible in the half: a ¥178 thousand gain on sale of fixed assets and a ¥386 thousand loss on retirement of fixed assets, which is why ordinary profit and pre-tax profit sit within ¥1 million of each other.
| Metric | H1 FY12/2026 | H1 FY12/2025 | Change |
|---|---|---|---|
| Revenue (¥ million) | 4,114 | 4,653 | −11.6% |
| Gross profit (¥ million) | 1,189 | 1,384 | −14.1% |
| SG&A expenses (¥ million) | 949 | 923 | +2.8% |
| Operating profit (¥ million) | 239 | 460 | −48.0% |
| Operating margin | 5.8% | 9.9% | −4.1 pt |
| Ordinary profit (¥ million) | 251 | 467 | −46.2% |
| Net profit attrib. to owners of parent (¥ million) | 159 | 312 | −48.8% |
| Comprehensive income (¥ million) | 231 | 327 | −29.4% |
| EPS (¥) | 23.38 | 45.67 | −48.8% |
| Technical Information Solutions — revenue (¥ million) | 1,762 | 1,715 | +2.7% |
| Technical Information Solutions — segment profit (¥ million) | 424 | 405 | +4.8% |
| FA Robot Solutions — revenue (¥ million) | 525 | 478 | +9.7% |
| FA Robot Solutions — segment profit (¥ million) | 39 | 24 | +60.1% |
| Digital Solutions — revenue (¥ million) | 1,856 | 2,498 | −25.7% |
| Digital Solutions — segment profit (¥ million) | 133 | 396 | −66.3% |
| Total assets (¥ million) | 10,981 | 10,600 | +3.6% |
| Net assets (¥ million) | 8,871 | 8,892 | −0.2% |
| Equity ratio | 80.8% | 83.9% | −3.1 pt |
| FY12/2026 guidance — revenue (¥ million) | 9,451 | — | +7.1% |
| FY12/2026 guidance — operating profit (¥ million) | 993 | — | +44.9% |
| FY12/2026 guidance — ordinary profit (¥ million) | 992 | — | +42.3% |
| FY12/2026 guidance — net profit (¥ million) | 663 | — | +45.3% |
| FY12/2026 guidance — EPS (¥) | 97.21 | — | n.m. |
| Annual dividend per share (¥) | 74.00 | 74.00 | unchanged |
JapanStockPulse provides informational content only and does not constitute investment advice. Figures are taken from the company's published earnings short report and may be subject to subsequent revision.