An operating result of ¥3 million
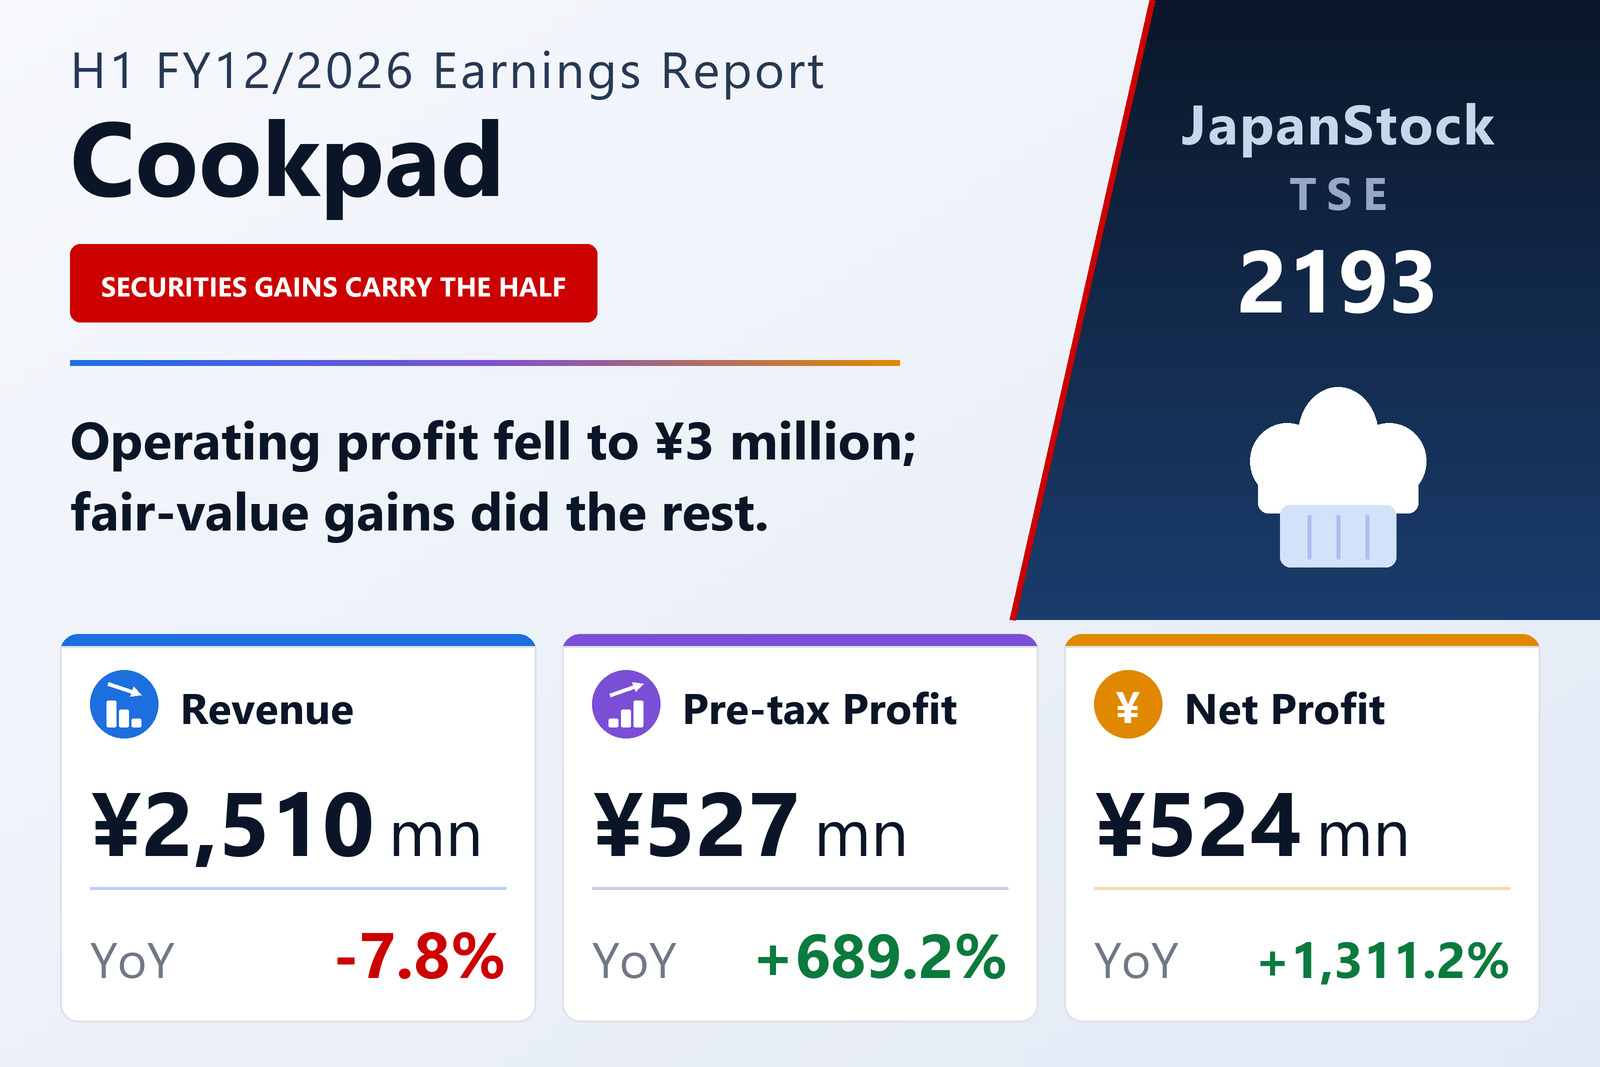
Cookpad Inc. (TSE: 2193) published consolidated results for the six months to June 30, 2026 on August 7, 2026 under IFRS. Revenue fell 7.8% to ¥2,510 million, which the company attributes chiefly to a decline in premium members of its recipe service. Operating profit fell 98.1% to ¥3 million — an operating margin of 0.1% against 5.9% — and the group is, at the operating line, essentially at break-even.
Selling, general and administrative expenses actually fell 1.4% to ¥2,486 million, but the path there matters: the half carried ¥185 million of one-off costs from headcount reductions at overseas bases, concentrated in the first quarter as part of a drive to make the operating structure more efficient. Personnel costs then fell in the second quarter as that reduction took effect. Strip the ¥185 million out and the operating result would have been comfortably positive; the company does not present it that way, and neither do we, but it is the difference between a business that has stopped earning and one that paid for a restructuring.
Everything below the operating line went the other way
Pre-tax profit rose 689.2% to ¥527 million and profit attributable to owners of the parent 1,311.2% to ¥524 million, for earnings per share of ¥7.25 against ¥0.46. The cause is stated plainly: movements in market conditions led the company to record, as finance income, the change in fair value of securities it holds at the period-end valuation. Comprehensive income rose 837.6% to ¥582 million.
Per-share growth outran net-profit growth because the share count fell sharply. The company bought back 1,422,100 of its own shares during the first quarter and then, on March 31, 2026, cancelled 28,621,500 treasury shares — reducing capital surplus by ¥5,035 million, retained earnings by ¥791 million and treasury stock by ¥5,826 million. Shares outstanding fell from 107,429,400 to 78,807,900, a reduction of more than a quarter.
One segment, and a very clean balance sheet
Cookpad reports a single segment — the business of "making everyday cooking fun" — so no segment breakdown is given. Beyond the recipe service, the group runs moment and Cookpad Mart, aimed at removing the obstacles it sees between people and enjoying cooking every day.
Total assets rose 2.0% from the December year-end to ¥14,390 million and equity attributable to owners of the parent 3.0% to ¥13,281 million, taking the ratio to 92.3% from 91.5%. A balance sheet that is 92% equity is unusual even among internet companies, and it is what allows a half-year of near-zero operating profit to pass without financial strain.
No guidance, by design
The company does not publish FY12/2026 guidance. Its stated reason is that it intends to invest actively in delivering its service to people in Japan and worldwide, and will judge the timing and scale of that investment flexibly as its operating environment changes — which makes a reasonable forecast impractical. No dividend is planned, as in FY12/2025.
The mission is written into the articles of incorporation, unusually: the company exists to make everyday cooking fun, and states that it will dissolve once every household in the world enjoys cooking every day. That is context rather than a financial fact, but it is the frame the company itself puts around a half in which it spent its operating profit on restructuring overseas.
| Metric | H1 FY12/2026 | H1 FY12/2025 | Change |
|---|---|---|---|
| Revenue (¥ million) | 2,510 | 2,723 | −7.8% |
| Operating profit (¥ million) | 3 | 161 | −98.1% |
| Operating margin | 0.1% | 5.9% | −5.8 pt |
| Pre-tax profit (¥ million) | 527 | 66 | +689.2% |
| Net profit attrib. to owners of parent (¥ million) | 524 | 37 | +1,311.2% |
| Comprehensive income (¥ million) | 582 | 62 | +837.6% |
| EPS (¥) | 7.25 | 0.46 | +1,476.1% |
| Total assets (¥ million) | 14,390 | 14,102 | +2.0% |
| Equity attrib. to owners of parent (¥ million) | 13,281 | 12,897 | +3.0% |
| Equity ratio | 92.3% | 91.5% | +0.8 pt |
| Annual dividend per share (¥) | 0.00 | 0.00 | unchanged |
JapanStockPulse provides informational content only and does not constitute investment advice. Figures are taken from the company's published earnings short report and may be subject to subsequent revision.