A one-off gain carries the bottom line
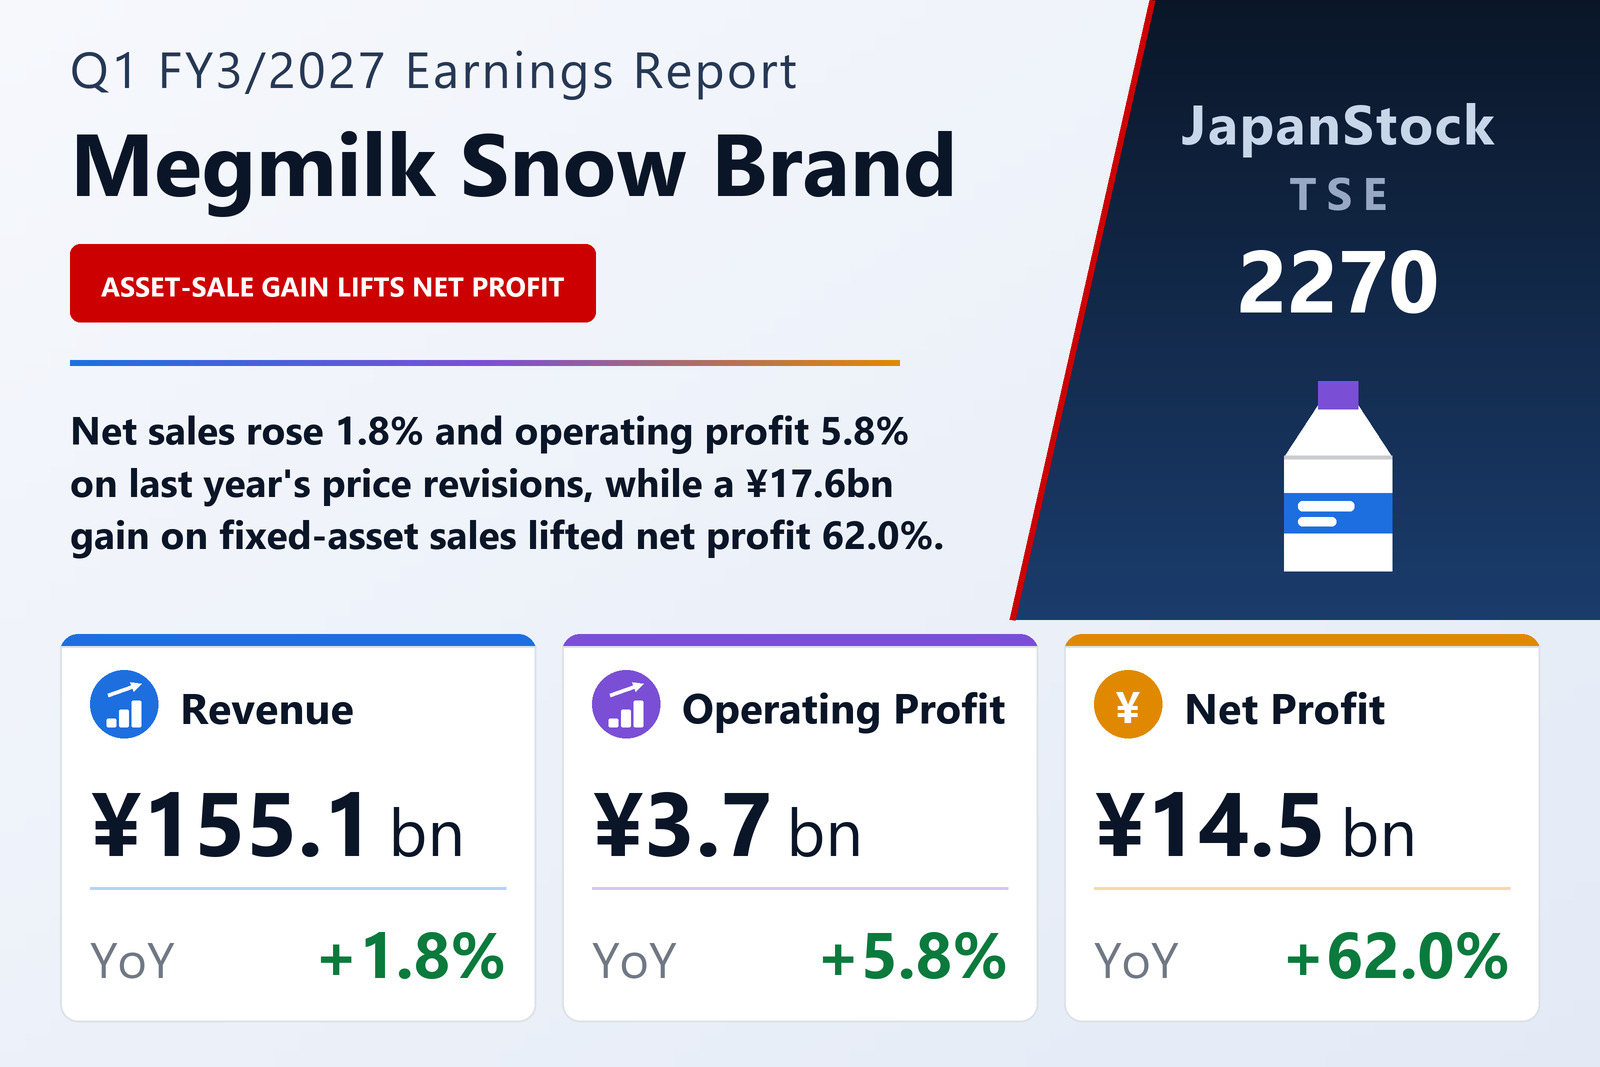
Megmilk Snow Brand Co., Ltd. (TSE: 2270), the dairy group whose shares are also listed on the Sapporo Securities Exchange, published consolidated results for the first quarter of FY3/2027 — the three months from April 1 to June 30, 2026 — on August 7, 2026 under Japanese GAAP. Net sales rose 1.8% to ¥155,129 million and operating profit 5.8% to ¥3,678 million, but ordinary profit fell 6.4% to ¥4,026 million. Net profit attributable to owners of the parent jumped 62.0% to ¥14,539 million, for earnings per share of ¥240.58 against ¥137.32.
The company attributes the net-profit increase mainly to gains on the sale of fixed assets tied to its head-office relocation. Extraordinary income came to ¥17,615 million, of which ¥17,590 million was gain on the sale of fixed assets, against just ¥2 million a year earlier. The prior-year quarter also carried a large one-off — ¥8,490 million from the sale of investment securities, within extraordinary income of ¥8,550 million — so the 62.0% compares one gain with another. Extraordinary losses rose to ¥602 million, including ¥179 million of factory reorganisation costs, and pre-tax profit of ¥21,039 million (+68.0%) bore ¥6,457 million of income taxes.
Price revisions lift operating profit; lower dividend income trims ordinary profit
All three reportable segments grew revenue. Cost of sales rose 1.8% to ¥129,119 million, in line with sales, so gross profit gained 1.6% to ¥26,009 million; SG&A expenses rose only 0.9% to ¥22,330 million, leaving operating profit up 5.8% and the operating margin at 2.4% against 2.3%. The company credits price revisions it made last year to offset a range of cost increases.
Ordinary profit nonetheless fell. The filing gives no reason, but the income statement shows non-operating income dropping to ¥594 million from ¥1,110 million: dividends received fell to ¥92 million from ¥469 million, and the share of profit of equity-method affiliates to ¥322 million from ¥437 million.
Cheese and drinks grow, butter and fats weaken
Dairy Products — cheese, butter, powdered milk, fats and oils, functional foods and infant formula — grew revenue 1.5% to ¥64,957 million, but segment profit fell 20.7% to ¥1,380 million. Butter fell against a temporary rise in demand a year earlier ahead of last July's price revision, and fats and oils fell on weak market demand; cheese grew on promotions and stronger in-store visibility, led by its flagship pull-apart string cheese. Despite active promotion, sales volumes fell more than the company expected and fixed costs rose, which it gives as the reasons profit fell.
Beverages & Desserts — milk drinks, fruit juices, yogurt, desserts and fresh cream — grew revenue 1.8% to ¥66,686 million and posted the strongest profit gain, up 42.0% to ¥915 million. The MBP Drink series of foods with function claims rose sharply and supply of school-lunch milk expanded into new areas. Yogurt grew overall even though the flagship Megumi Gasseri SP yogurt series fell against last year's post-relaunch promotions, as family-size and small-format products sold well; desserts also grew. The company credits last year's price revisions and strong core products for the profit increase.
Feed & Seeds — cattle feed, forage and vegetable seeds, and landscaping — grew revenue 4.9% to ¥13,859 million as price revisions outweighed lower compound-feed volumes, but profit fell 11.4% to ¥530 million on those lower volumes and higher expenses. The Other segment, which covers joint distribution centres and property leasing, saw revenue slip 0.8% to ¥9,625 million while profit rose 89.0% to ¥863 million; the filing gives no reason for that increase. Segment sales are to external customers.
Tax payments push operating cash flow negative
Operating cash flow swung to an outflow of ¥10,592 million from an inflow of ¥951 million. Income taxes paid rose to ¥11,892 million from ¥1,810 million, and the ¥17,211 million net gain on sales and disposals of fixed assets is deducted as a non-cash item, with the sale proceeds shown under investing activities. Investing cash flow was an inflow of ¥14,028 million, including ¥21,261 million of proceeds from sales of property, plant, equipment and intangibles against ¥6,735 million of capital expenditure. Financing used ¥7,904 million, mainly ¥5,980 million of dividends and ¥1,504 million of share buybacks (¥12,437 million a year earlier). Cash and equivalents ended June at ¥9,612 million.
Total assets fell 1.2% from March 31 to ¥421,598 million. Land dropped by ¥5,922 million to ¥41,219 million and cash and deposits by ¥4,384 million to ¥9,656 million, while merchandise and finished goods rose by ¥4,682 million to ¥51,380 million. Liabilities fell to ¥174,316 million from ¥186,078 million as income taxes payable came down to ¥5,417 million from ¥12,828 million. Net assets rose 2.7% to ¥247,282 million, lifting the equity ratio to 57.9% from 55.7%.
Under a board resolution of May 14, 2026 the company bought back 427,000 shares in the quarter, raising treasury stock by ¥1,503 million to ¥9,671 million. Average shares outstanding fell to 60,436,091 from 65,365,265, which is why earnings per share rose 75.2%, faster than net profit.
Guidance unchanged
Guidance published on May 14, 2026 was left unchanged. For FY3/2027 the company expects net sales of ¥645,000 million (+4.7%), operating profit of ¥21,000 million (+15.0%), ordinary profit of ¥21,800 million (+6.4%) and net profit of ¥24,500 million (−25.5%), with earnings per share of ¥413.03 reflecting the buyback. First-half targets are net sales of ¥323,000 million (+4.5%), operating profit of ¥9,700 million (+5.7%), ordinary profit of ¥10,100 million (−4.7%) and net profit of ¥17,400 million (+54.2%).
The first quarter delivered 17.5% of the full-year operating-profit target and, because of the asset-sale gain, 59.3% of the net-profit target. The dividend forecast is ¥100.00 per share, the same as for FY3/2026. The quarter falls in the second year of the company's Next Design 2030 management plan, announced in May 2025.
| Metric | Q1 FY3/2027 | Q1 FY3/2026 | Change |
|---|---|---|---|
| Net sales (¥ million) | 155,129 | 152,395 | +1.8% |
| Cost of sales (¥ million) | 129,119 | 126,783 | +1.8% |
| Gross profit (¥ million) | 26,009 | 25,611 | +1.6% |
| SG&A expenses (¥ million) | 22,330 | 22,135 | +0.9% |
| Operating profit (¥ million) | 3,678 | 3,476 | +5.8% |
| Operating margin | 2.4% | 2.3% | +0.1 pt |
| Ordinary profit (¥ million) | 4,026 | 4,300 | −6.4% |
| Extraordinary income (¥ million) | 17,615 | 8,550 | +106.0% |
| — gain on sale of fixed assets (¥ million) | 17,590 | 2 | n.m. |
| Extraordinary losses (¥ million) | 602 | 326 | +84.7% |
| Pre-tax profit (¥ million) | 21,039 | 12,524 | +68.0% |
| Income taxes (¥ million) | 6,457 | 3,523 | +83.3% |
| Net profit attrib. to owners of parent (¥ million) | 14,539 | 8,976 | +62.0% |
| Comprehensive income (¥ million) | 14,122 | 4,299 | +228.5% |
| EPS (¥) | 240.58 | 137.32 | +75.2% |
| Dairy Products — revenue (¥ million) | 64,957 | 63,973 | +1.5% |
| Dairy Products — segment profit (¥ million) | 1,380 | 1,740 | −20.7% |
| Beverages & Desserts — revenue (¥ million) | 66,686 | 65,515 | +1.8% |
| Beverages & Desserts — segment profit (¥ million) | 915 | 644 | +42.0% |
| Feed & Seeds — revenue (¥ million) | 13,859 | 13,208 | +4.9% |
| Feed & Seeds — segment profit (¥ million) | 530 | 598 | −11.4% |
| Other — revenue (¥ million) | 9,625 | 9,698 | −0.8% |
| Other — segment profit (¥ million) | 863 | 456 | +89.0% |
| Operating cash flow (¥ million) | −10,592 | 951 | n.m. |
| Investing cash flow (¥ million) | 14,028 | 2,455 | +471.4% |
| Financing cash flow (¥ million) | −7,904 | −15,445 | n.m. |
| Cash and deposits (¥ million) | 9,656 | 14,041 | −31.2% |
| Total assets (¥ million) | 421,598 | 426,820 | −1.2% |
| Net assets (¥ million) | 247,282 | 240,741 | +2.7% |
| Equity ratio | 57.9% | 55.7% | +2.2 pt |
| FY3/2027 guidance — revenue (¥ million) | 645,000 | — | +4.7% |
| FY3/2027 guidance — operating profit (¥ million) | 21,000 | — | +15.0% |
| FY3/2027 guidance — ordinary profit (¥ million) | 21,800 | — | +6.4% |
| FY3/2027 guidance — net profit (¥ million) | 24,500 | — | −25.5% |
| FY3/2027 guidance — EPS (¥) | 413.03 | — | — |
| Annual dividend per share (¥) | 100.00 | 100.00 | unchanged |
JapanStockPulse provides informational content only and does not constitute investment advice. Figures are taken from the company's published earnings short report and may be subject to subsequent revision.