Every segment up, one of them by 81%
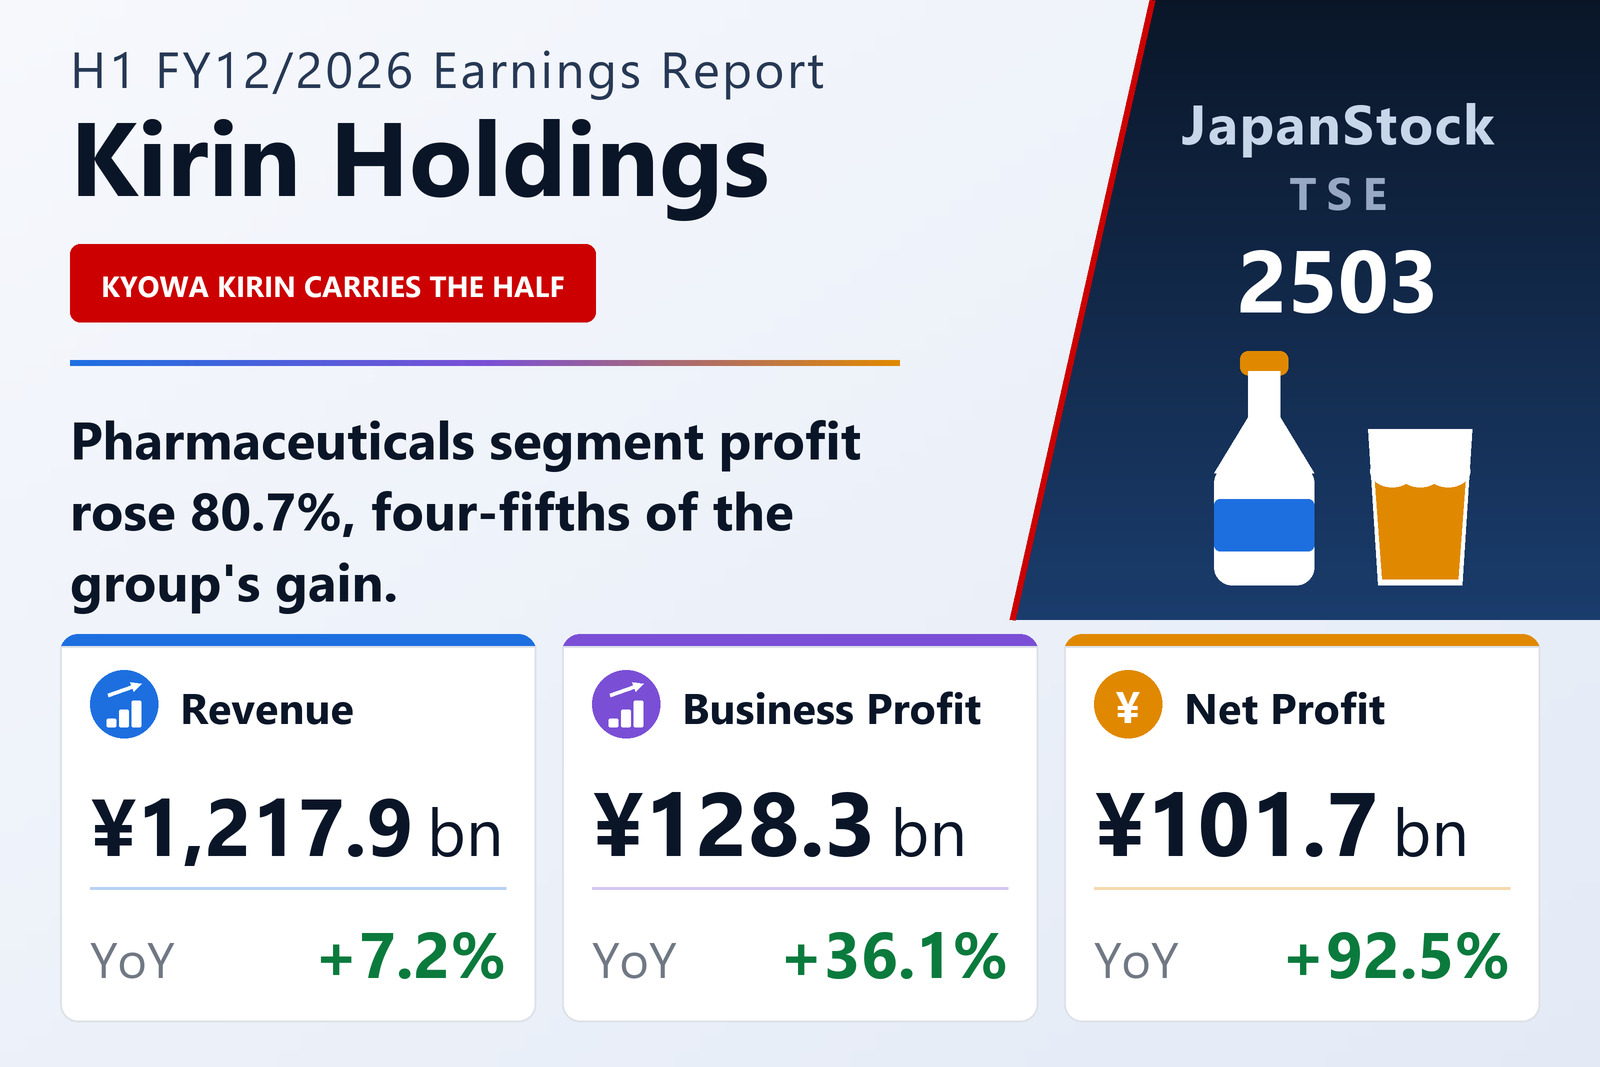
Kirin Holdings Company, Limited (TSE: 2503) published consolidated results for the six months to June 30, 2026 on August 7, 2026 under IFRS. Revenue rose 7.2% to ¥1,217,876 million and business profit — the company's preferred measure of recurring performance, revenue less cost of sales and SG&A — rose 36.1% to ¥128,303 million. Pre-tax profit rose 80.1% to ¥150,855 million and profit attributable to owners of the parent 92.5% to ¥101,720 million, for earnings per share of ¥126.33 against ¥65.23.
All four reportable segments grew both revenue and profit, which is unusual for a group this diversified. Pharmaceuticals — Kyowa Kirin — did the heavy lifting: revenue up 14.3% to ¥263,629 million and segment profit up 80.7% to ¥60,540 million. That single segment contributed ¥27,037 million of the group's ¥34,058 million business-profit increase, or roughly four-fifths of it.
The drinks businesses grew steadily; pharma did not
Alcoholic Beverages, still the largest segment at ¥519,111 million, grew revenue 5.1% and segment profit 16.8% to ¥62,094 million. Non-alcoholic Beverages grew revenue faster, up 8.5% to ¥296,673 million, but profit only 4.8% to ¥30,965 million. Health Science — FANCL and Blackmores — was nearly flat on revenue at ¥131,103 million (+1.1%) but lifted profit 20.8% to ¥10,403 million. The Other category widened its loss to ¥1,475 million from ¥591 million.
Read side by side, the drinks businesses delivered the kind of mid-single-digit growth a mature beverage group is expected to produce, and the deviation from that pattern is entirely in pharmaceuticals.
Below business profit, a ¥26 billion swing
Pre-tax profit grew faster than business profit for a reason worth isolating. Other operating income was ¥45,043 million against ¥2,135 million a year earlier, while other operating expenses were ¥44,304 million against ¥27,658 million. Netted, that line swung from −¥25,523 million to +¥739 million — a ¥26.3 billion improvement that sits outside the recurring business. Four Roses, the bourbon distiller, left the scope of consolidation during the half.
Financial income was ¥12,551 million (against ¥4,644 million), financial expenses ¥11,044 million, and share of profit of equity-method investees ¥20,306 million (against ¥19,392 million). The reference operating-profit figure — business profit plus the net other-operating line — was ¥129,042 million, up 87.8%.
Balance sheet and revised guidance
Total assets fell 2.7% from the December year-end to ¥3,401,276 million while equity attributable to owners of the parent rose 5.8% to ¥1,361,975 million, lifting the ratio to 40.0% from 36.8%. Comprehensive income was ¥157,581 million against just ¥2,282 million a year earlier.
Full-year FY12/2026 guidance was revised: revenue of ¥2,480,000 million (+1.9%), business profit of ¥253,000 million (+0.5%), pre-tax profit of ¥259,000 million (+8.9%) and profit attributable to owners of the parent of ¥160,000 million (+8.4%), for earnings per share of ¥200.00. Reference operating profit is guided at ¥230,000 million (+9.7%).
Set against the half just reported, that guidance is conservative to the point of being striking: business profit of ¥128,303 million in six months against a full-year target of ¥253,000 million implies almost no growth in the second half, and net profit of ¥101,720 million against ¥160,000 million implies a materially weaker one. The annual dividend forecast rises to ¥76.00 per share from ¥74.00, split ¥38.00 interim and ¥38.00 year-end.
| Metric | H1 FY12/2026 | H1 FY12/2025 | Change |
|---|---|---|---|
| Revenue (¥ million) | 1,217,876 | 1,136,309 | +7.2% |
| Business profit (¥ million) | 128,303 | 94,245 | +36.1% |
| Operating profit (¥ million) | 129,042 | 68,723 | +87.8% |
| Pre-tax profit (¥ million) | 150,855 | 83,761 | +80.1% |
| Net profit attrib. to owners of parent (¥ million) | 101,720 | 52,835 | +92.5% |
| Comprehensive income (¥ million) | 157,581 | 2,282 | n.m. |
| EPS (¥) | 126.33 | 65.23 | +93.7% |
| Alcoholic Beverages — revenue (¥ million) | 519,111 | 493,787 | +5.1% |
| Alcoholic Beverages — business profit (¥ million) | 62,094 | 53,162 | +16.8% |
| Non-alcoholic Beverages — revenue (¥ million) | 296,673 | 273,403 | +8.5% |
| Non-alcoholic Beverages — business profit (¥ million) | 30,965 | 29,537 | +4.8% |
| Pharmaceuticals — revenue (¥ million) | 263,629 | 230,654 | +14.3% |
| Pharmaceuticals — business profit (¥ million) | 60,540 | 33,503 | +80.7% |
| Health Science — revenue (¥ million) | 131,103 | 129,736 | +1.1% |
| Health Science — business profit (¥ million) | 10,403 | 8,615 | +20.8% |
| Total assets (¥ million) | 3,401,276 | 3,494,043 | −2.7% |
| Equity attrib. to owners of parent (¥ million) | 1,361,975 | 1,286,991 | +5.8% |
| Equity ratio | 40.0% | 36.8% | +3.2 pt |
| FY12/2026 guidance — revenue (¥ million) | 2,480,000 | — | +1.9% |
| FY12/2026 guidance — business profit (¥ million) | 253,000 | — | +0.5% |
| FY12/2026 guidance — pre-tax profit (¥ million) | 259,000 | — | +8.9% |
| FY12/2026 guidance — net profit (¥ million) | 160,000 | — | +8.4% |
| FY12/2026 guidance — EPS (¥) | 200.00 | — | n.m. |
| Annual dividend per share (¥) | 76.00 | 74.00 | +2.7% |
JapanStockPulse provides informational content only and does not constitute investment advice. Figures are taken from the company's published earnings short report and may be subject to subsequent revision.