Flat at the top, mixed underneath
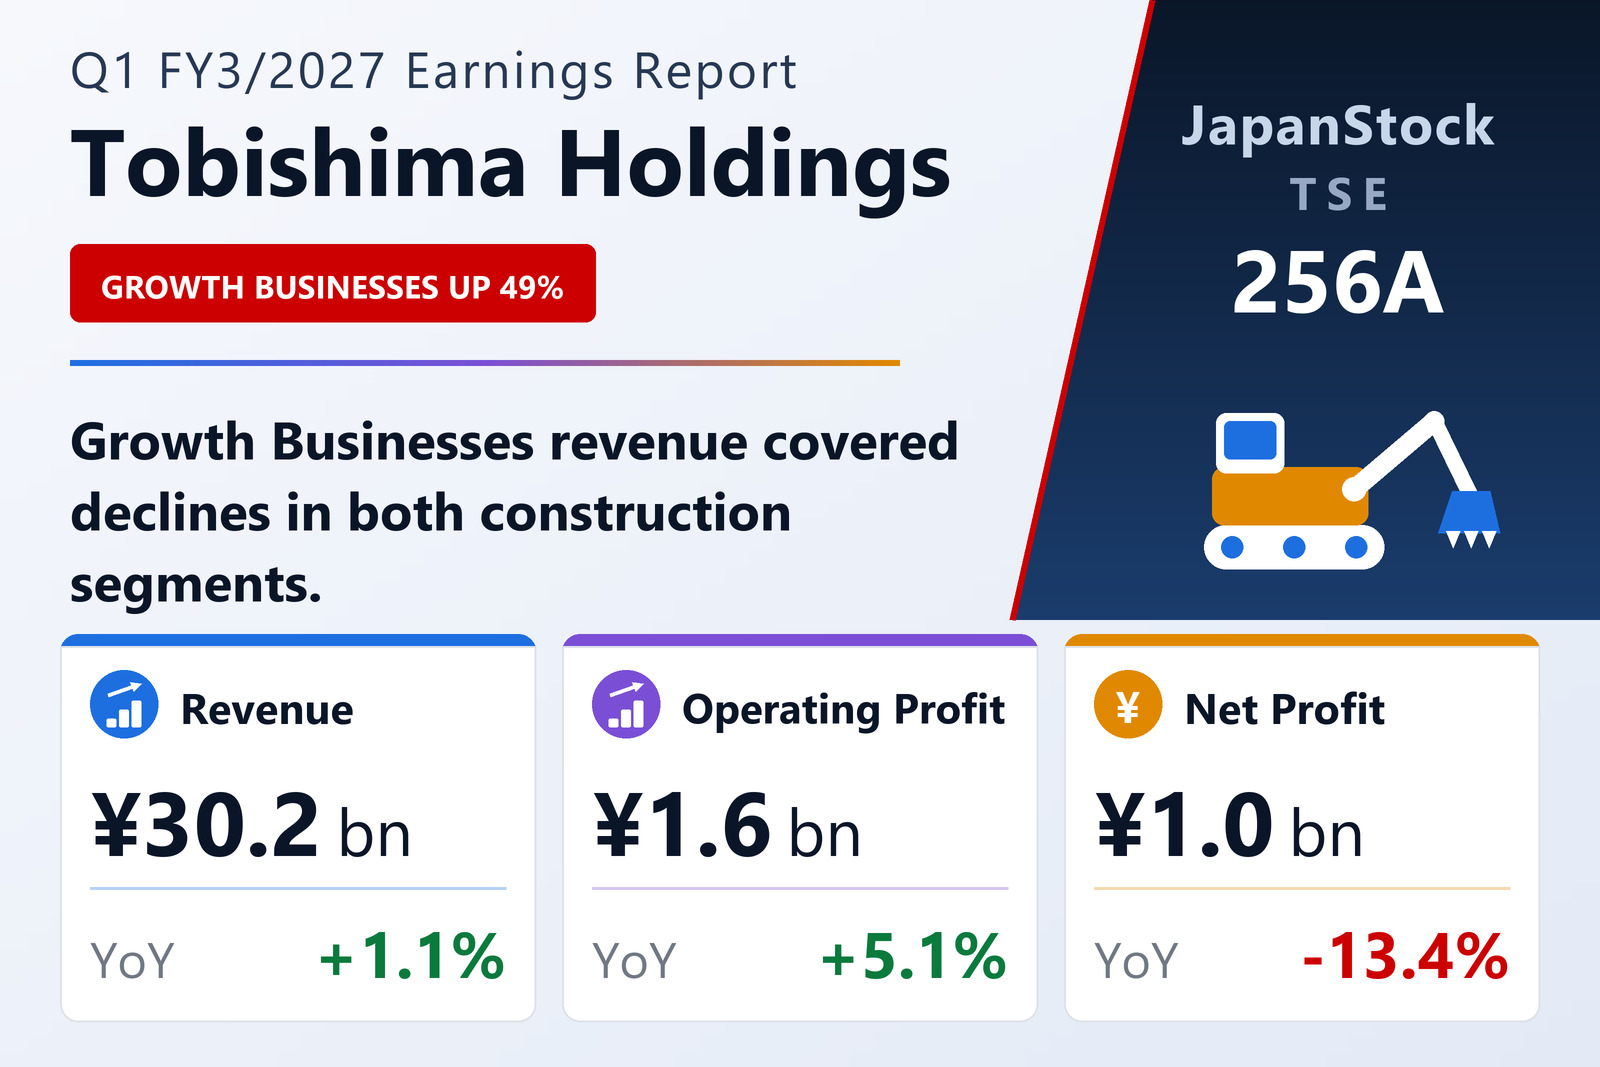
Tobishima Holdings, Inc. (TSE: 256A) published consolidated results for the three months to June 30, 2026 on August 7, 2026 under Japanese GAAP. Net sales rose 1.1% to ¥30,243 million, operating profit 5.1% to ¥1,624 million and ordinary profit 6.8% to ¥1,492 million, but net profit attributable to owners of the parent fell 13.4% to ¥1,015 million, for earnings per share of ¥52.93 against ¥61.24. Comprehensive income fell 43.3% to ¥739 million.
The company notes that it was established by a sole share transfer on October 1, 2024, so no year-on-year percentages were shown for the first quarter of FY3/2026 in that period's own filing; this quarter is the first with a clean comparison against a full prior-year quarter.
The construction core shrank; the newer business filled in
Civil Engineering, the largest segment, saw external revenue fall 9.7% to ¥13,150 million yet segment profit edge up 2.2% to ¥1,117 million — less work, better margin. Building Construction was near-flat on revenue at ¥11,471 million (−1.0%) with segment profit up 22.6% to ¥906 million, the strongest profit improvement on the page.
Growth Businesses ran the other way: revenue up 49.3% to ¥5,621 million, adding ¥1,855 million and more than covering the ¥1,520 million the two construction segments gave up, but segment profit fell 14.9% to ¥504 million. The segment now supplies 19% of external revenue against 13% a year ago.
Read together, the quarter is a business trading construction volume for construction margin while scaling a lower-margin third leg. Unallocated corporate costs and eliminations took ¥904 million off the segment total.
A balance sheet that shrank sharply
Total assets fell 10.8% from the March year-end to ¥145,476 million — ¥17.6 billion in three months — while net assets fell only 2.3% to ¥53,176 million, so the equity ratio rose to 36.5% from 33.3%. For a contractor a fall of that size in one quarter usually reflects the settlement cycle on completed work rather than any change in the business.
Guidance unchanged, and it asks for a lot from the rest of the year
Guidance for FY3/2027 is unchanged: net sales of ¥150,000 million (+7.7%), operating profit of ¥8,000 million (+15.8%), ordinary profit of ¥7,000 million (+17.3%) and net profit of ¥4,800 million (−0.9%), for earnings per share of ¥250.11.
The quarter has delivered 20.3% of the full-year operating-profit target and 20.2% of the sales target, so the guidance implies a materially stronger remaining nine months — revenue growth of 7.7% for the year against 1.1% in the quarter. Note too that the company forecasts operating and ordinary profit up double digits while net profit edges down, which points to a smaller extraordinary or tax contribution than last year. The annual dividend forecast rises to ¥110.00 per share from ¥105.00, paid entirely at the year-end.
| Metric | Q1 FY3/2027 | Q1 FY3/2026 | Change |
|---|---|---|---|
| Net sales (¥ million) | 30,243 | 29,908 | +1.1% |
| Operating profit (¥ million) | 1,624 | 1,546 | +5.1% |
| Operating margin | 5.4% | 5.2% | +0.2 pt |
| Ordinary profit (¥ million) | 1,492 | 1,398 | +6.8% |
| Net profit attrib. to owners of parent (¥ million) | 1,015 | 1,172 | −13.4% |
| Comprehensive income (¥ million) | 739 | 1,304 | −43.3% |
| EPS (¥) | 52.93 | 61.24 | −13.6% |
| Civil Engineering — revenue (¥ million) | 13,150 | 14,555 | −9.7% |
| Civil Engineering — segment profit (¥ million) | 1,117 | 1,093 | +2.2% |
| Building Construction — revenue (¥ million) | 11,471 | 11,586 | −1.0% |
| Building Construction — segment profit (¥ million) | 906 | 739 | +22.6% |
| Growth Businesses — revenue (¥ million) | 5,621 | 3,766 | +49.3% |
| Growth Businesses — segment profit (¥ million) | 504 | 592 | −14.9% |
| Total assets (¥ million) | 145,476 | 163,096 | −10.8% |
| Net assets (¥ million) | 53,176 | 54,409 | −2.3% |
| Equity ratio | 36.5% | 33.3% | +3.2 pt |
| FY3/2027 guidance — revenue (¥ million) | 150,000 | — | +7.7% |
| FY3/2027 guidance — operating profit (¥ million) | 8,000 | — | +15.8% |
| FY3/2027 guidance — ordinary profit (¥ million) | 7,000 | — | +17.3% |
| FY3/2027 guidance — net profit (¥ million) | 4,800 | — | −0.9% |
| FY3/2027 guidance — EPS (¥) | 250.11 | — | n.m. |
| Annual dividend per share (¥) | 110.00 | 105.00 | +4.8% |
JapanStockPulse provides informational content only and does not constitute investment advice. Figures are taken from the company's published earnings short report and may be subject to subsequent revision.